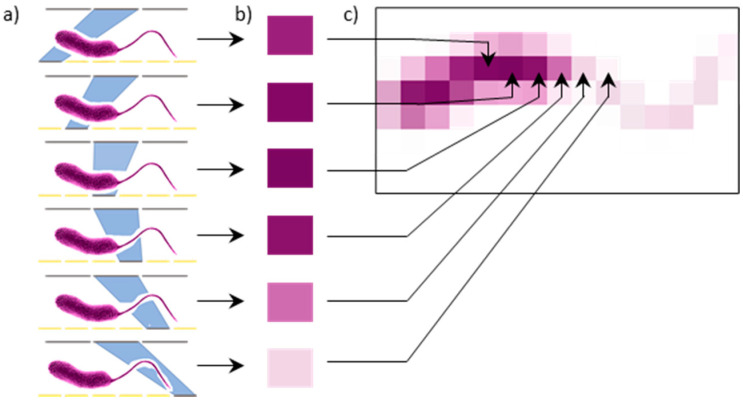
Figure 1.
Image formation in NIM and e-STOM. The object is placed on the LED array/microdisplay. Every LED is switched on and off sequentially (a), and a detector records the light intensity transmitted through the sample (b). The image is formed by tiling every detected intensity as associated with the position of the lit LED (c).

