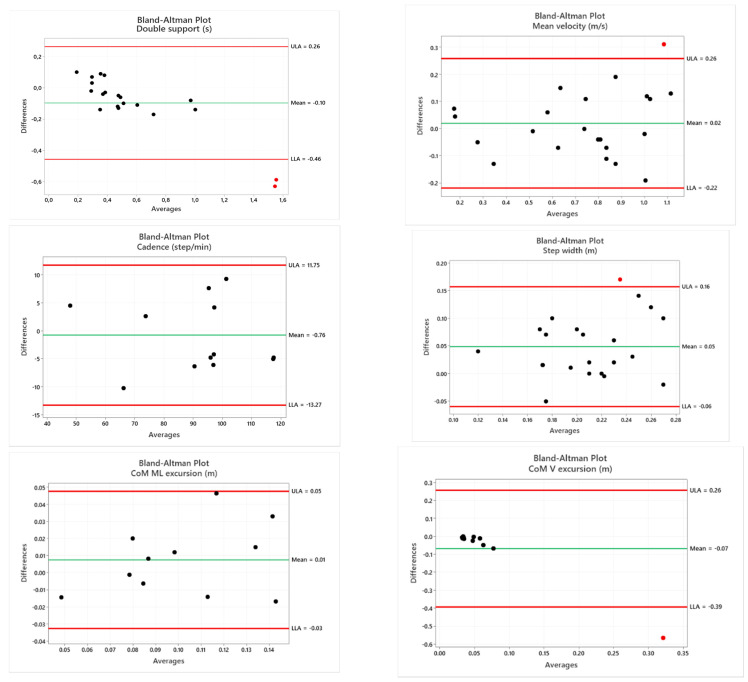
Figure 6.
Bland–Altman plots of the mean of instrumented 3D-GA and the RGB-D systems plotted against the difference between the two methods. For all spatiotemporal parameters, 22 values are reported because they are considered separately for the right and left limb, with the exception of cadence [12] and parameters related to COM.


