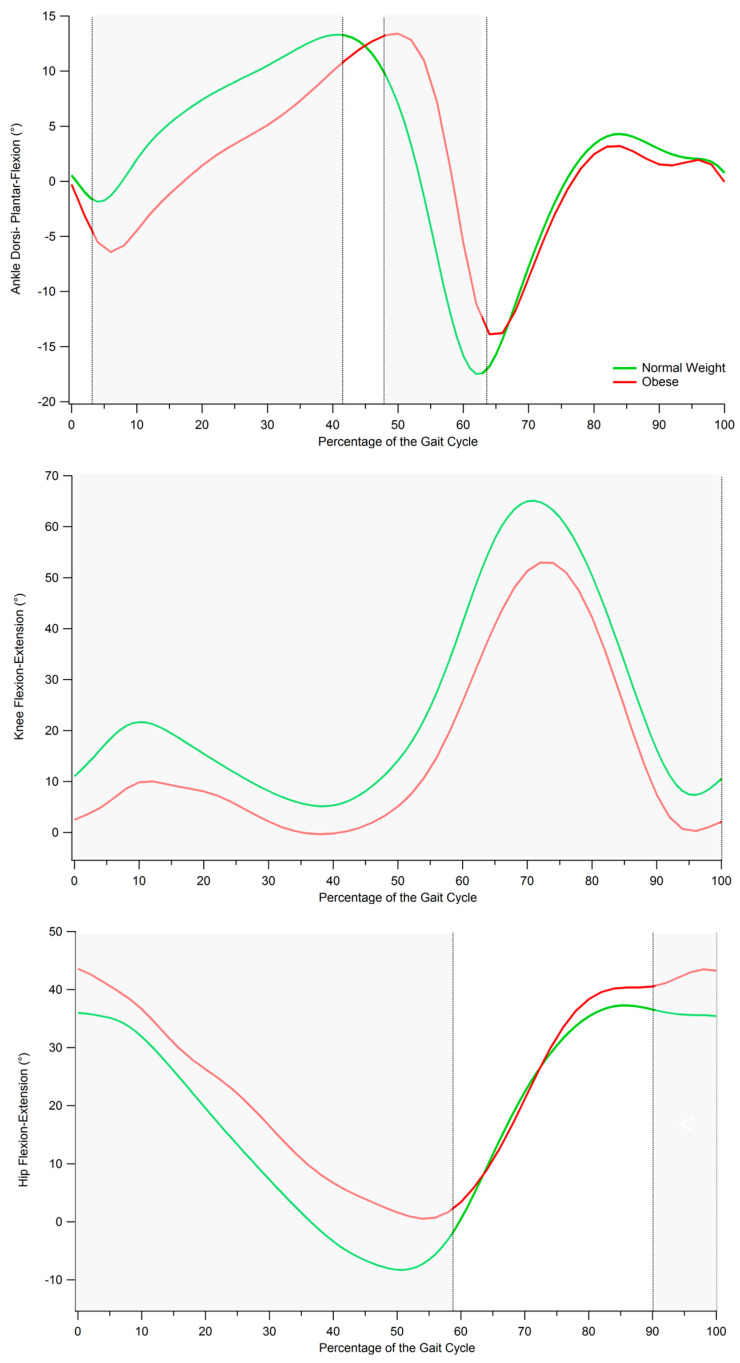
Figure 2.
Gait kinematics in the sagittal plane for normal weight and obese individuals. From top to bottom: ankle dorsi-plantar-flexion, knee flexion-extension, and hip flexion-extension angles during gait cycle. Grey-shaded areas denote the periods of the gait cycle in which a significant difference between groups was detected (p < 0.05).

