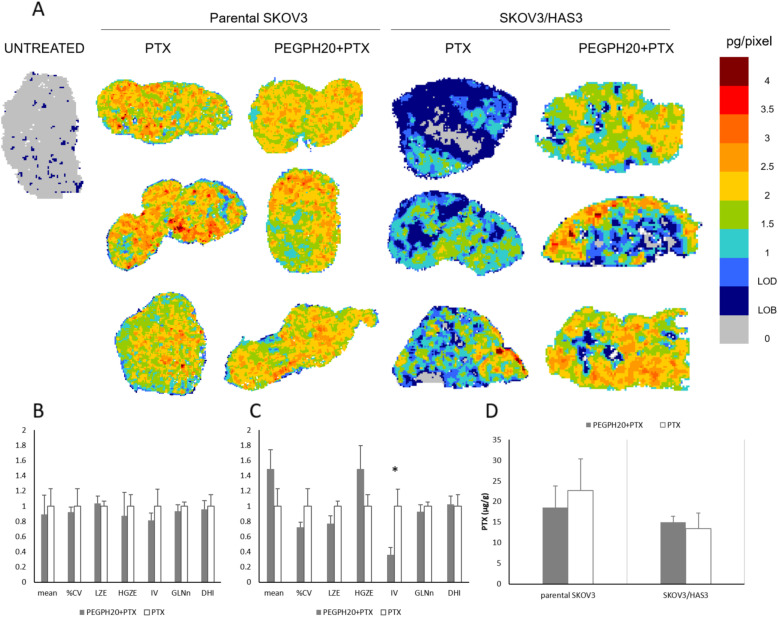
Fig. 2.
PTX distribution in SKOV3 and SKOV3/HAS3 tumors 4 h after a single PTX treatment, with or without PEGPH20 pre-treatment. Three tumours were analysed for each group. A Mass spectrometry images. One representative section of three analysed for each tumour is shown. B GLSZM features in SKOV3 and C SKOV3/HAS3 tumours. A selected panel of features (mean, CV%, LZE-Large-Zone Emphasis, HGZE-High Grey-level Zone Emphasis, IV-Intensity Variability, GLNn-normalised Grey-Level Non-uniformity and DHI-Drug Homogeneity Index) describing drug distribution and influenced by PEGPH20 pre-treatment is presented. The mean value of each feature was rescaled to the PTX mean for comparison (*p-value< 0.05). D Tumour concentrations of PTX measured by HPLC in the second half of the same tumours analysed for MSI

