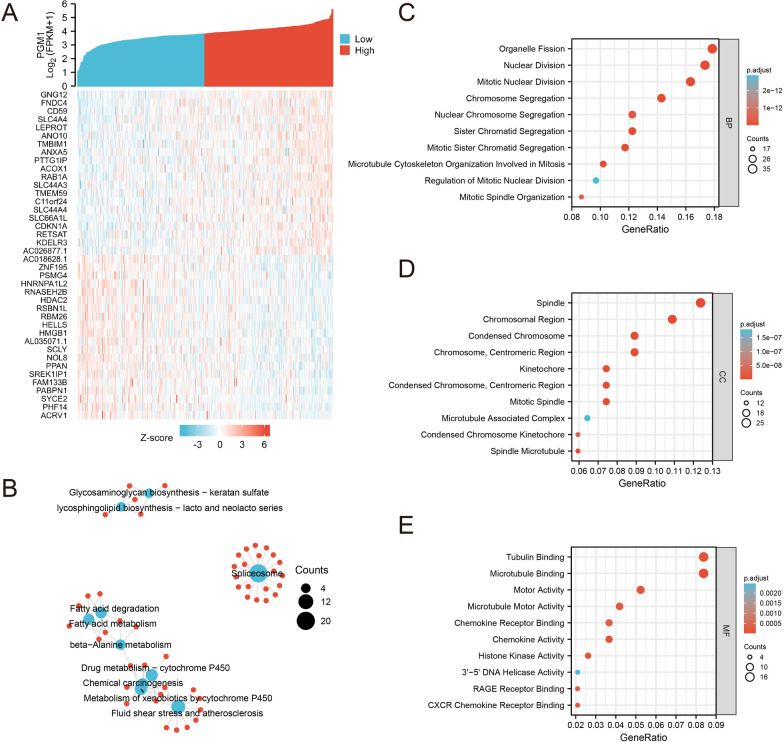
Fig. 2.
Correlation and enrichment analyses of PGM1. a The relative expression of PGM1 in GC tissues from TCGA database were shown above, which were divided into low and high groups according to the median expression. Top 20 genes that most positively associated with PGM1 expression and top 20 genes that most negatively associated with it were displayed below. b KEGG network to display top 10 pathways associated with PGM1 expression. c Top 10 BP terms that were significantly enriched in GO analysis. d Top 10 CC terms that were significantly enriched in GO analysis. e Top 10 MF terms that were significantly enriched in GO analysis. PGM1: Phosphoglucomutase 1; GC: gastric cancer; TCGA: The Cancer Genome Atlas; BP: biological process; CC: cellular component; MF: molecular function; KEGG: Kyoto Encyclopedia of Genes and Genomes; GO: Gene ontology

