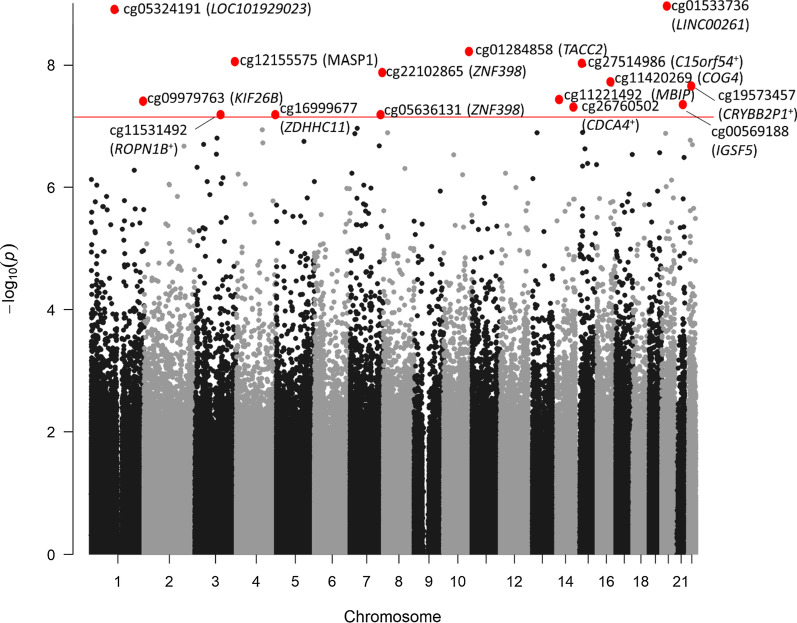
Fig. 2.
Manhattan plot of epigenetic loci associated with cumulative prenatal risk. The x-axis shows the genomic location of individual CpG sites and the y-axis shows the −log10(p values) from models relating cumulative prenatal risk to CpG methylation, adjusting for child sex, recruitment site, postmenstrual age at collection, sample batch, and cellular heterogeneity. Gene annotations have been added for all CpGs yielding significant associations after Bonferroni adjustment. The horizontal red line depicts the Bonferroni adjusted p-value threshold (α = 0.05/706323). +indicates closest gene

