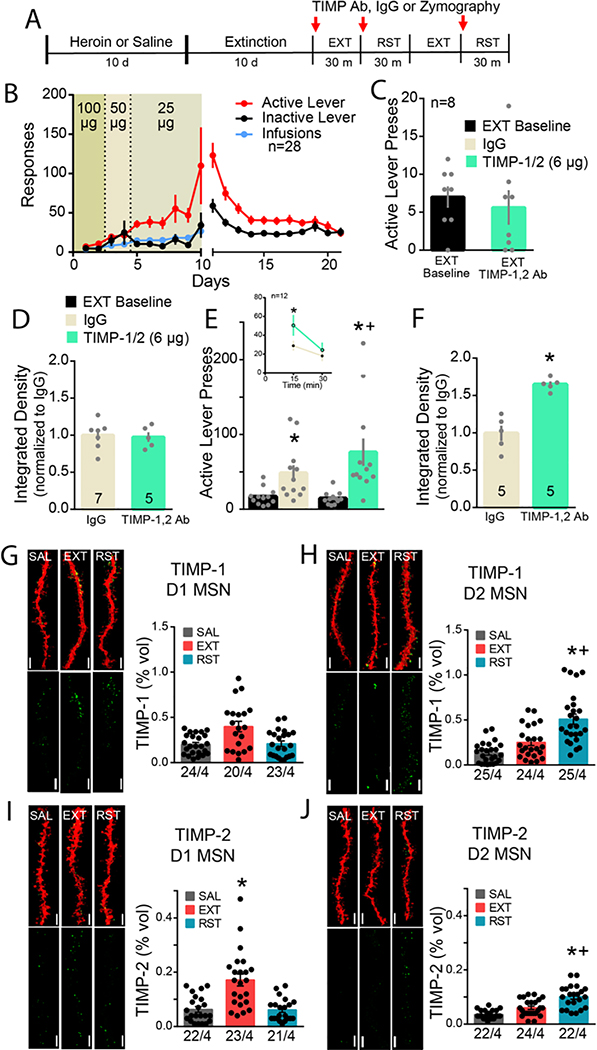
Figure 6. TIMP-1,2 inhibition potentiates cue-induced heroin seeking via cell specific TIMP-1,2 expression around D1 and D2 MSNs.
A) Experimental timeline outlining heroin self-administration, extinction, and reinstatement and TIMP inhibitor cross-over design. B) Rats were trained to self-administer heroin and responding to the heroin-paired cues was subsequently extinguished. C) No difference in refraining behavior with TIMP-1,2 antibody pre-treatment in NAcore compared to extinction baseline (Paired t-test; t(7)=0.83; p=0.434). D) No difference in MMP-2,9 activity, quantified as integrated density, in refraining controls compared to TIMP-1,2 antibody-treated animals (Unpaired t-test; t(10)=0.24; p=0.815). E) Reinstated animals (t=30 min) received IgG or TIMP-1,2 antibodies microinjected in NAcore in randomized crossover design. Combined TIMP-1,2 inhibition potentiated cued heroin seeking compared to IgG (2-way ANOVA; treatment (IgG/TIMP) F(1,11)=6.70; p=0.025; EXT/RST F(1,11)=11.56; p=0.006; interaction F(1,11)=6.65; p=0.026). No difference in inactive lever presses during cue-induced heroin seeking after IgG or TIMP-1,2 antibody microinjection in NAcore (2-way ANOVA; F(1,11)=0.33; p=0.573). Inset: Time course of reinstatement session revealed enhanced heroin seeking in first 15 min compared to IgG controls (2-way ANOVA; treatment F(1,22)=1.75; p=0.200; time F(1,22)=28.40; p<0.001; interaction F(1,22)=4.94; p=0.037). F) Simultaneous TIMP-1,2 inhibition significantly potentiated MMP-2/9 enzymatic activity in NAcore during cue-induced heroin reinstatement (Unpaired t-test; F(4,4)=7.94; p=0.001). N in bars indicates number of animals with an average of four-seven NAcore slices/rat. Bar=250 μm. Data are shown as mean ± SEM and integrated density was normalized to control mean. *p<0.05 compared to extinction, +p<0.05 compared to IgG using Sidak post hoc test. G) Representative images of 3D reconstruction of mCherry-labeled dendritic segments (red) and TIMP-1 or −2 puncta (green) localized within 300 nm of dendrite surface for each group SAL, EXT, and RST 15’ are shown beside each corresponding graph. No difference in TIMP-1 expression around D1 MSNs across groups (Nested 1-way ANOVA; F(2,9)=1.32; p=0.315). H) Increased TIMP-2 immunoreactivity around D1 dendritic segments under extinguished conditions compared to SAL and RST (Nested 1-way ANOVA; F(2,9)=7.20; p=0.014). c) Increased TIMP-1 and I/J) TIMP-2 immunoreactivity around D2 dendritic segments during cued heroin seeking (Nested 1-ANOVA; TIMP-1, F(2,9)=19.08; p=0.001; TIMP-2, F(2,71)=17.63; p<0.001). TIMP-1 and −2 expression was elevated around D2 MSNs during heroin seeking compared to D1 MSNs (TIMP-1, Nested t-test; F(1,6)=9.03; p=0.024; TIMP-2, Nested t-test; F(1,47)=9.91; p=0.003). Data shown as mean ± SEM. N represents number of neurons quantified over number of animals in each condition. *p<0.05 compared to SAL, +p<0.05 compared to EXT using Sidak post hoc test. Bar= 5 μm.

