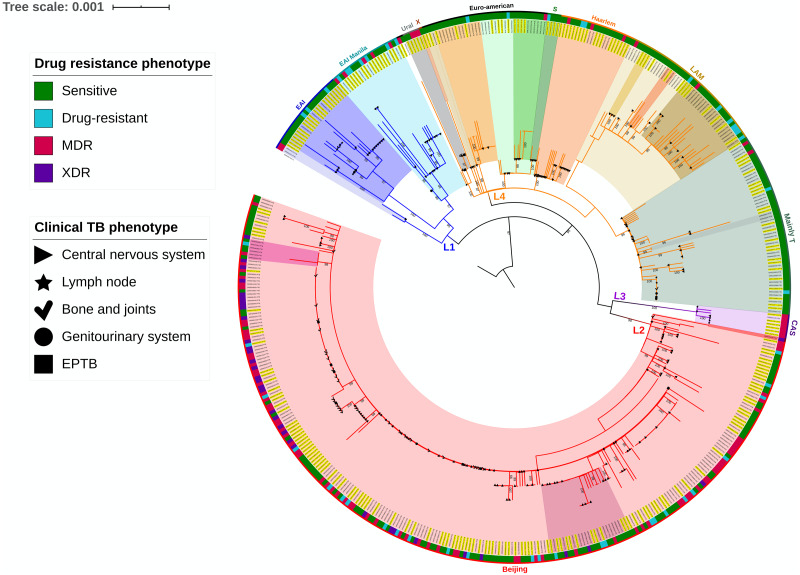
Figure 1. Phylogenetic analysis of M. tuberculosis strains from PTB and EPTB phenotypes of the disease.
Sensitive, does not present genotypic resistance; Drug-resistant, resistant to at least one antibiotic; MDR, resistant to at least isoniazid and rifampicin. Sensitive, does not present genotypic resistance; Drug-resistant, resistant to at least one antibiotic; MDR, resistant to at least isoniazid and rifampicin; XDR, resistant to isoniazid and rifampicin plus any fluoroquinolone and at least one of three injectable second-line drugs. The phylogenetic tree was inferred using the maximum likelihood (ML) criterion with a general time-reversible model of nucleotide substitution and a gamma model of rate heterogeneity. Yellow highlighted letters indicate EPTB strains. Support values correspond to bootstrap values. The topology was rooted with a Mycobacterium microti strain.

