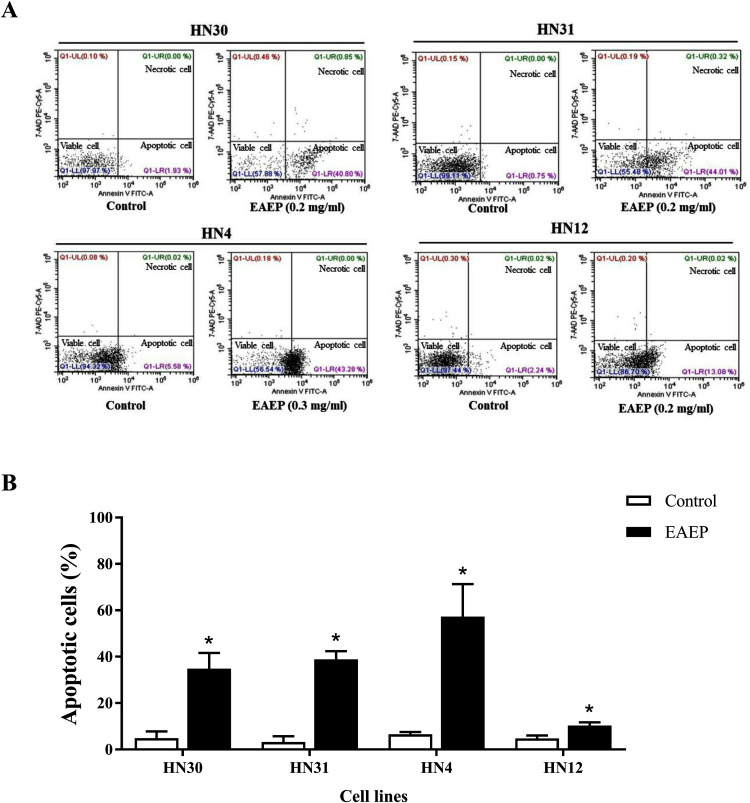
Figure 2. Effect of EAEP on HNSCC cells, after treatment for 24 h, evaluated by flow cytometry.
(A) Dot plots of apoptosis assay with Annexin V-FITC (X-axis)/ 7-AAD-PE (Y-axis). (B) Percentage of apoptotic HN30, HN31, HN4, and HN12 cells treated with 0.2, 0.2, 0.3 and 0.2 mg/ml EAEP, respectively for 24 h. Bars represent means ± SEM of three independent experiments (n = 3). *P < 0.05 compared with the control.

