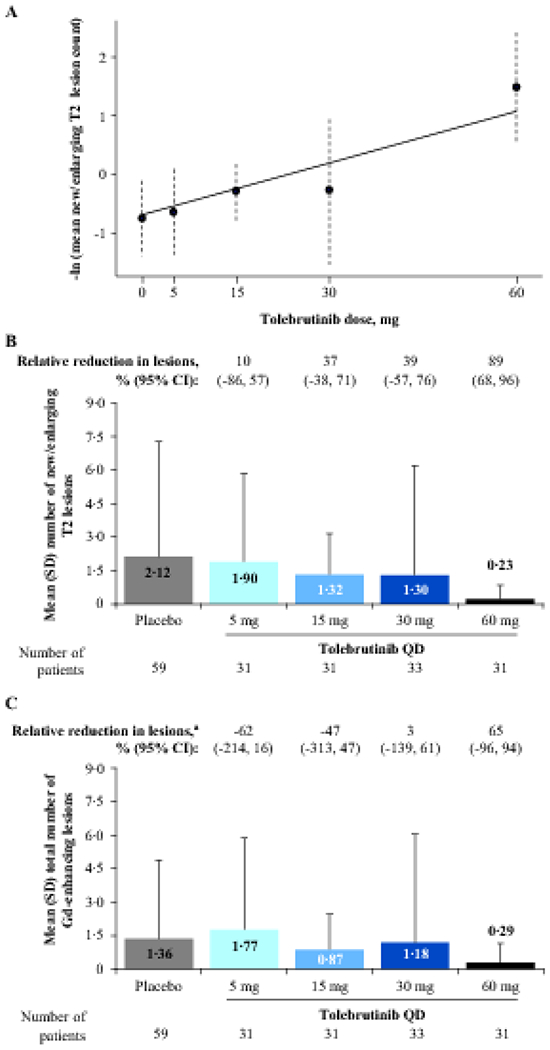
Figure 3: Secondary outcome: Number of new/enlarging T2 lesions and total number of Gd-enhancing lesions on an MRI scan after 12 weeks of tolebrutinib treatment.

Panel A shows the estimated dose-response curve using MCP-Mod methodology for the number of new or enlarging T2 lesions; error bars represent 95% CIs. The linear model was selected as the best fit based on the Akaike information criterion and was used to reject the null hypothesis (p<0·0001). Panel B shows the mean (SD) number of new or enlarging T2 lesions for pooled participants from Cohorts 1 and 2 at the end of 12 weeks of tolebrutinib treatment. In Cohort 2, the formation rate of new Gd-enhancing lesions over the 4-week placebo run-in period was assumed to be constant over the 16-week trial duration. Relative reductions in lesions versus placebo were analysed using a negative binomial model. Panel C shows the total number of Gd-enhancing lesions at the end of 12 weeks of tolebrutinib treatment, for which the MCP-Mod procedure did not allow for rejection of the null hypothesis. aRelative reduction in lesions versus placebo, with adjustment for baseline presence or absence of Gd-enhancing lesion activity using a negative binomial model. CI=confidence interval. Gd=gadolinium. MCP-Mod=multiple comparison procedure-modelling. MRI=magnetic resonance imaging. QD=once daily. SD=standard deviation.
