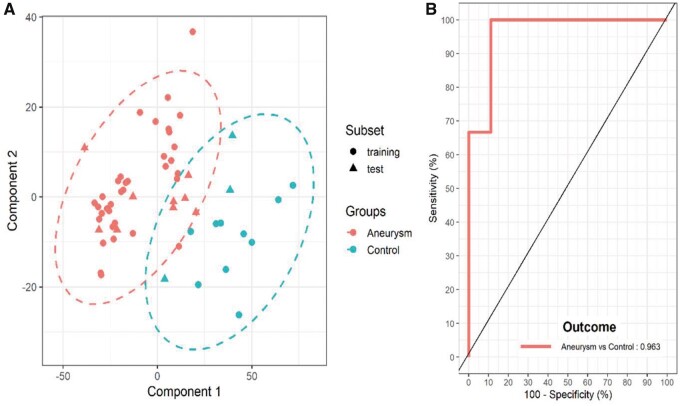
Figure 2:
Partial least squares-discriminant analysis representative model for rapid evaporative ionization mass spectrometry data between control (n = 13) and aneurysm patients (n = 44). (A) Score plot of the two-component model. Points represented for both training (circles) and test (triangles) for both groups control (cyan) and aneurysm (red) with ellipse representative of the 95% region around the means of each group. It is clear that the groups can be separated with this model. (B) Receiver operating curve of the model representing an area under the curve value of 0.963. Fifty models were fitted with average statistics reported in Supplementary Material, Table S2.

