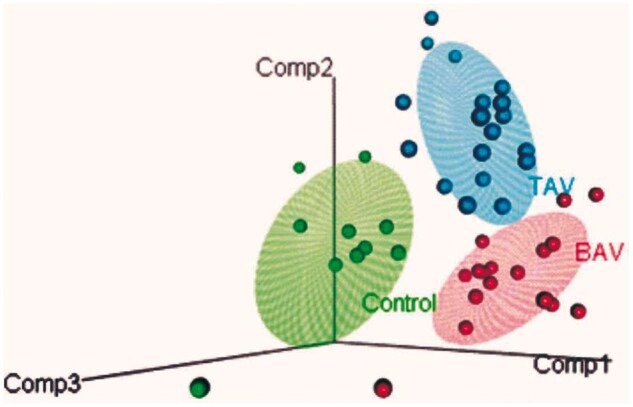
Figure 3:

Partial least squares-discriminant analysis representative model 3D plot for rapid evaporative ionization mass spectrometry data between control, bicuspid aortic valve and tricuspid aortic valve patients. Three-component model generated, each patient is represented as a circle for control (green, n = 13), bicuspid aortic valve (red, n = 21) and tricuspid aortic valve (blue, n = 23), with ellipse representative of the 95% region around the means of each group. Model statistics are reported in Supplementary Material, Table S4.
