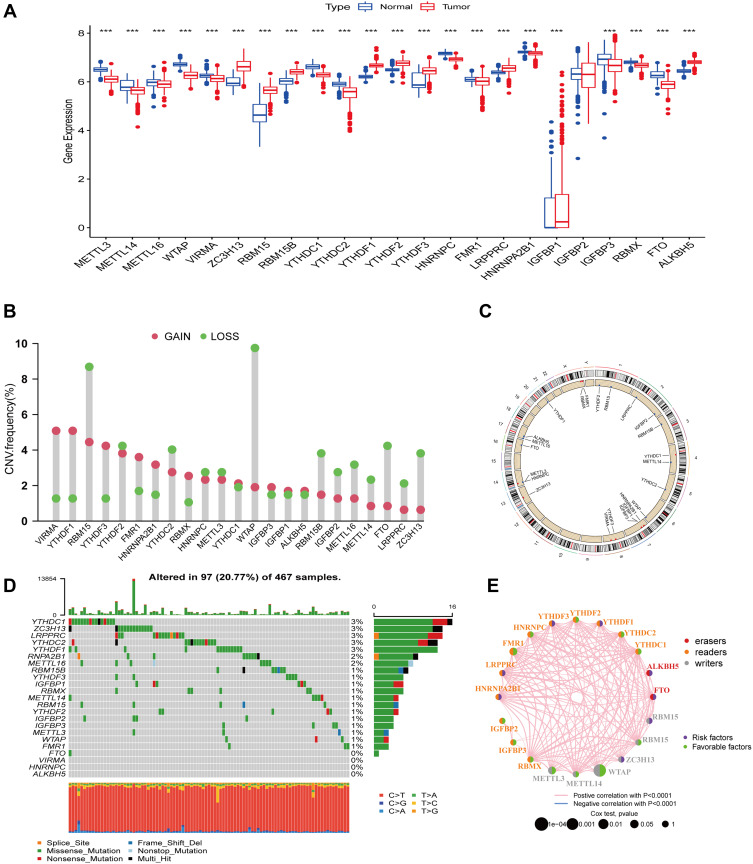
Figure 1.
Genetic and variational landscape of m6A regulators in SKCM. (A) Expression of 23 m6A-related genes in normal skin tissues versus cutaneous melanoma tissues. Blue represents normal tissues and red represents tumor tissues (***represents: P < 0.001). (B) m6A-related gene copy number variation frequency. Red represents gain and green represents a loss. (C) m6A-related gene copy number variation in different chromosomal locations. Red indicates that the sample with increased copy number is greater than the sample with loss, and blue indicates that the sample with loss is greater than the increase. (D) Waterfall plot of m6A regulators mutation levels. (E) Prognostic network for the m6A regulator. Red circles represent “erasers”, orange represents “readers”, and gray represents “writers”.

