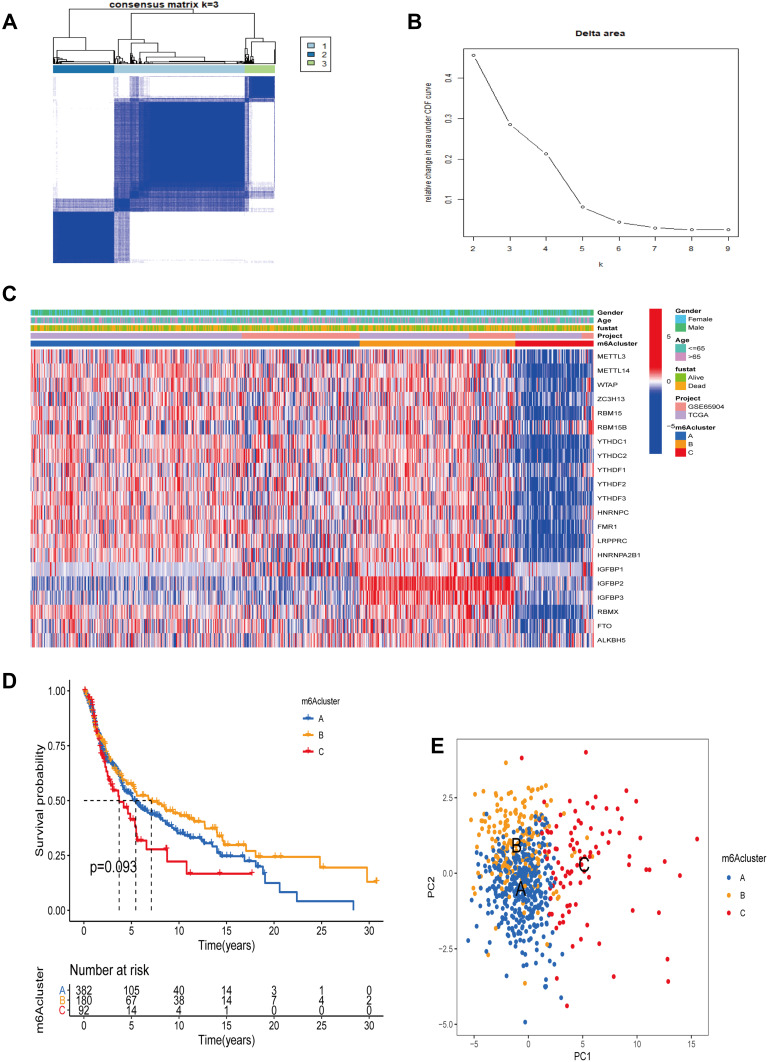
Figure 2.
Clustering analysis based on the expression of m6A-related genes. (A) Consensus clustering subclusters at K=3. (B) Relative change in the area under the CDF curve when K = 2 to 9. (C) The heatmap of m6A regulators and different clinical features in three subgroups. (D) Kaplan-Meier survival curves between three m6A subclusters. (E) Principal component analysis under m6A modification pattern.

