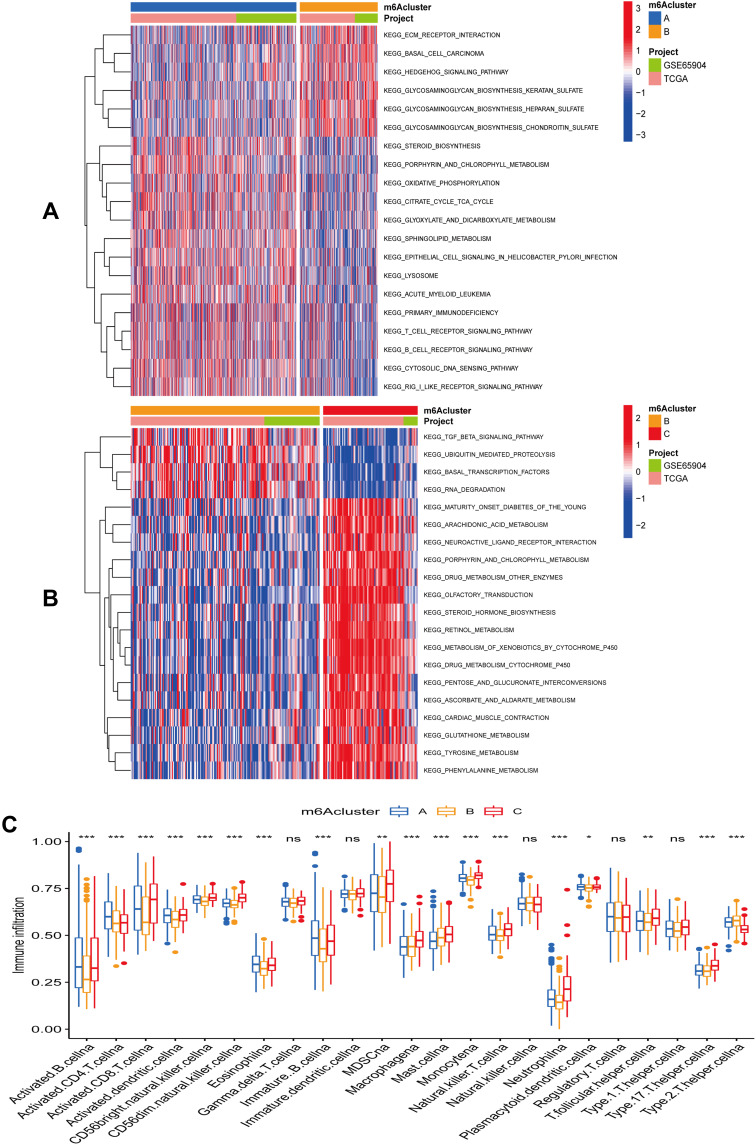
Figure 3.
GSVA and ssGSEA between different m6A subclusters. (A) GSVA analysis between subclusters A and B. (B) GSVA analysis between subclusters B and C. (C) Differential immune cell infiltration among three m6A subclusters in the SKCM immune microenvironment (***represents: P < 0.001; **represents P < 0.01; *represents P < 0.05).

