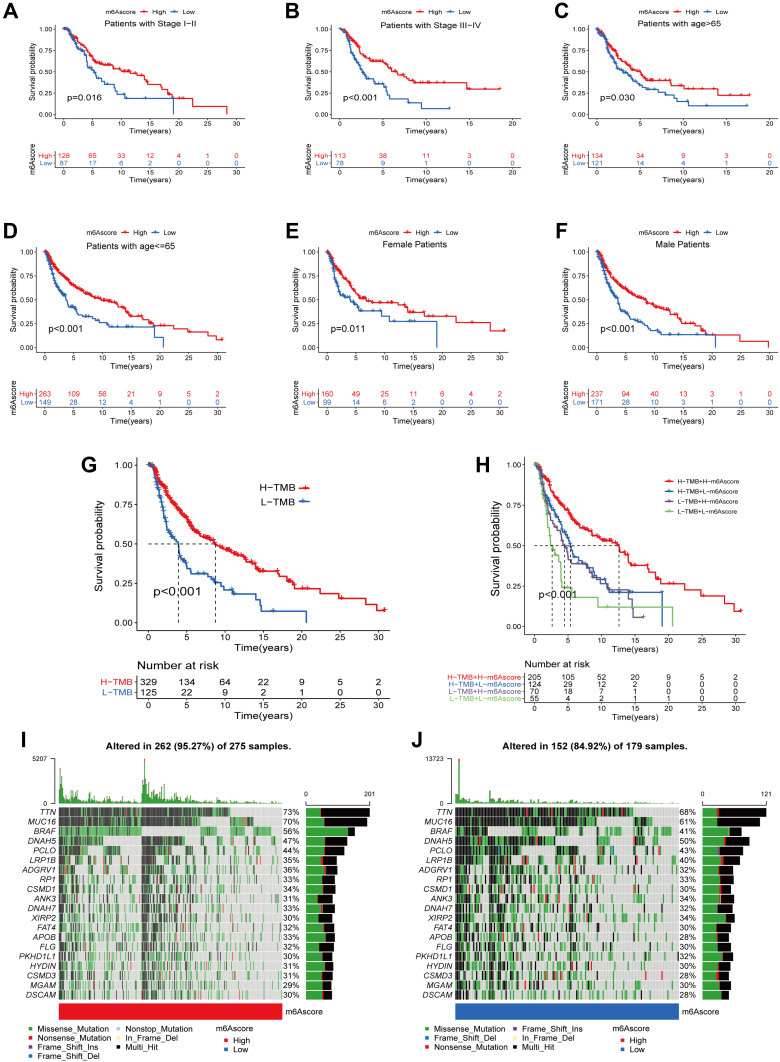
Figure 7.
Correlation analysis between m6A scores and different clinical features. (A–F) Kaplan-Meier survival analysis curves between high and low m6A score groups in different clinical features. (A) Patients with stage I–II; (B) Patients with stage III–IV; (C) Patients with age >65; (D) Patients with age ≤65; (E) Female patients; (F) Male patients. (G) Kaplan-Meier survival curves for high and low TMB groups. (H) Kaplan-Meier curves for SKCM patients stratified by TMB and m6A scores. (I and J) Mutation burden in high and low m6A score groups. (I) High m6A score group; (J) low m6A score group.

