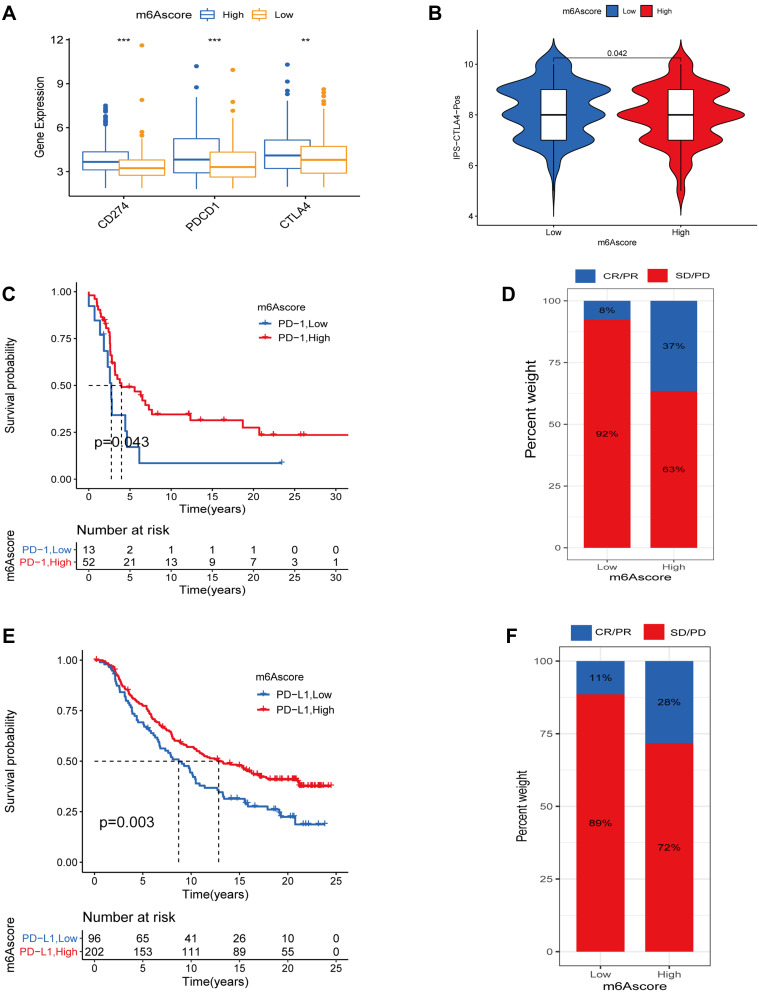
Figure 8.
The role of m6A score in predicting immunotherapy efficacy. (A) Differences in ICB genes in high and low m6A score groups (***represents: P < 0.001; **represents P < 0.01). (B) IPS between high and low m6A score groups when CTLA-4 positive. (C) Survival analysis curves between high and low m6A score groups in the GSE93157 cohort receiving anti-PD-1 therapy. (D) Proportion of patients responding to anti-PD-1 therapy in the high and low m6A score groups in the GSE93157 cohort. In high m6Ascore group response/nonresponse:37%/63% and 8/92% in low m6A score group. (E) Survival analysis curves between high and low m6A score groups in the IMvigor210 cohort receiving anti-PD-L1 therapy. (F) Proportion of patients responding to anti-PD-L1 therapy in the high and low m6A score groups in the IMvigor210 cohort. In high m6Ascore group response/nonresponse:28%/72% and 11/89% in low m6Ascore group.
Abbreviations: CR, complete response; PR, partial response; SD, stable disease; PD, progressive disease.

