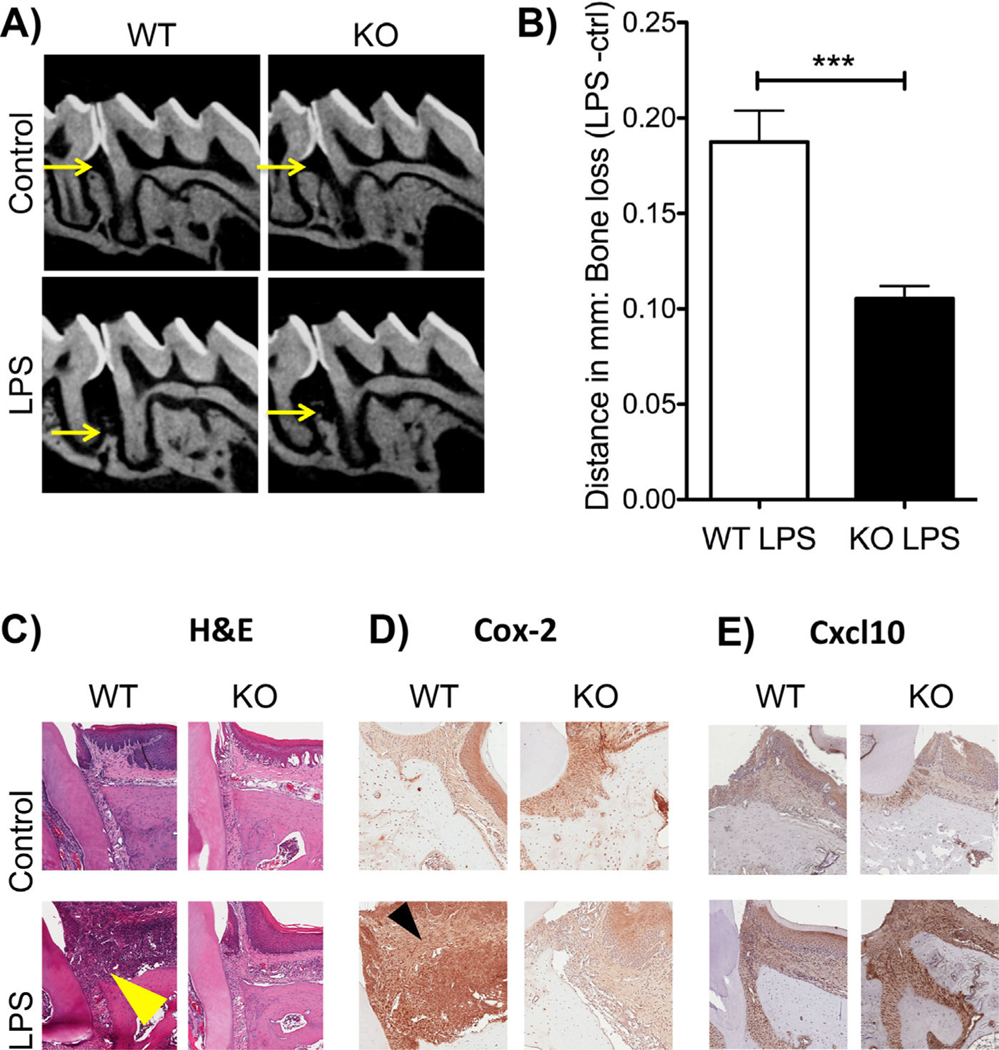
Fig. 4.
Deletion of Cxcr3 in vivo causes a reduction in bone loss. (A) Representative radiographic images of wild-type (WT) and Cxcr3 knockout (KO) control and LPS-treated mice. Note the increased bone loss in the WT LPS group compared with the KO LPS group. (B) Graph representing the bone loss (ctrl-LPS) of WT and KO mice. Significance was compared using a Student’s t test. n = 3 mice/group, p ≤ 0.05*, p ≤ 0.01**, p ≤ 0.001***. Data represented as mean standard error of the mean (SEM). (C) Hematoxylin and eosin (H&E)-stained tissue sections of WT and KO control and LPS-treated groups. Increased inflammatory infiltrates in the WT LPS group are denoted by the yellow arrow. (D) COX-2 immunostaining in WT and KO control and LPS groups. Increased COX-2 expression (brown stain) is denoted by the black arrow in the WT LPS. (E) Cxcl-10 immunostaining in WT and KO control and LPS groups. Increased Cxcl10 expression in the Cxcxr3 KO LPS-treated mice compared with WT LPS-treated mice (brown stain).

