Fig. 5.
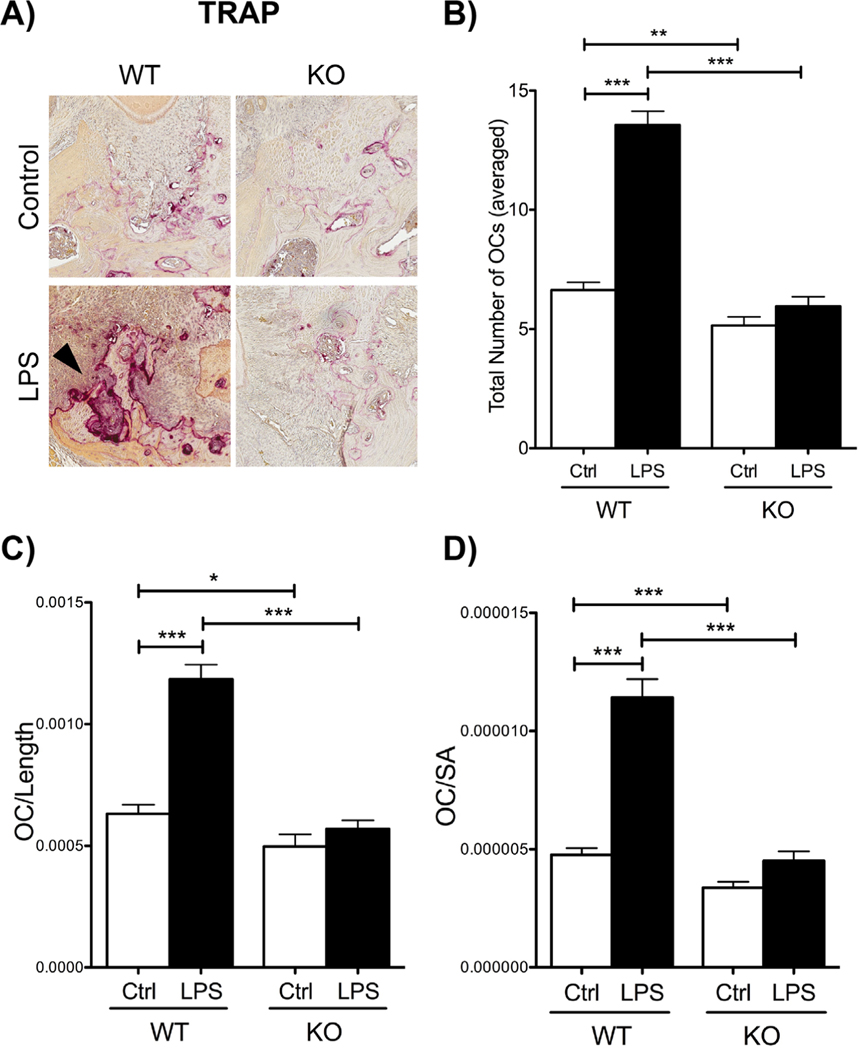
Histological assessment of osteoclast numbers in WT and Cxcr3 KO mice. (A) Tartrate-resistant acid phosphatase (TRAP+) staining for osteoclasts. Note the increase in TRAP+ cells in WT LPS-treated mice (black arrow) compared with KO LPS-treated mice. 20 magnification. (B) Graph representing total number of averaged osteoclasts in WT and Cxcr3 KO control and LPS groups. (C) Graph representing osteoclast numbers divided by the length of alveolar bone measured. (D) Graph representing osteoclast numbers divided by the surface area (SA) of the alveolar bone considered in analysis. For all graphs (B–D), significance was compared using a Student’s t test. n = 3 mice/group, p ≤ 0.05*, p ≤ 0.01**, p ≤ 0.001***. Data represented as mean ± standard error of the mean (SEM).

