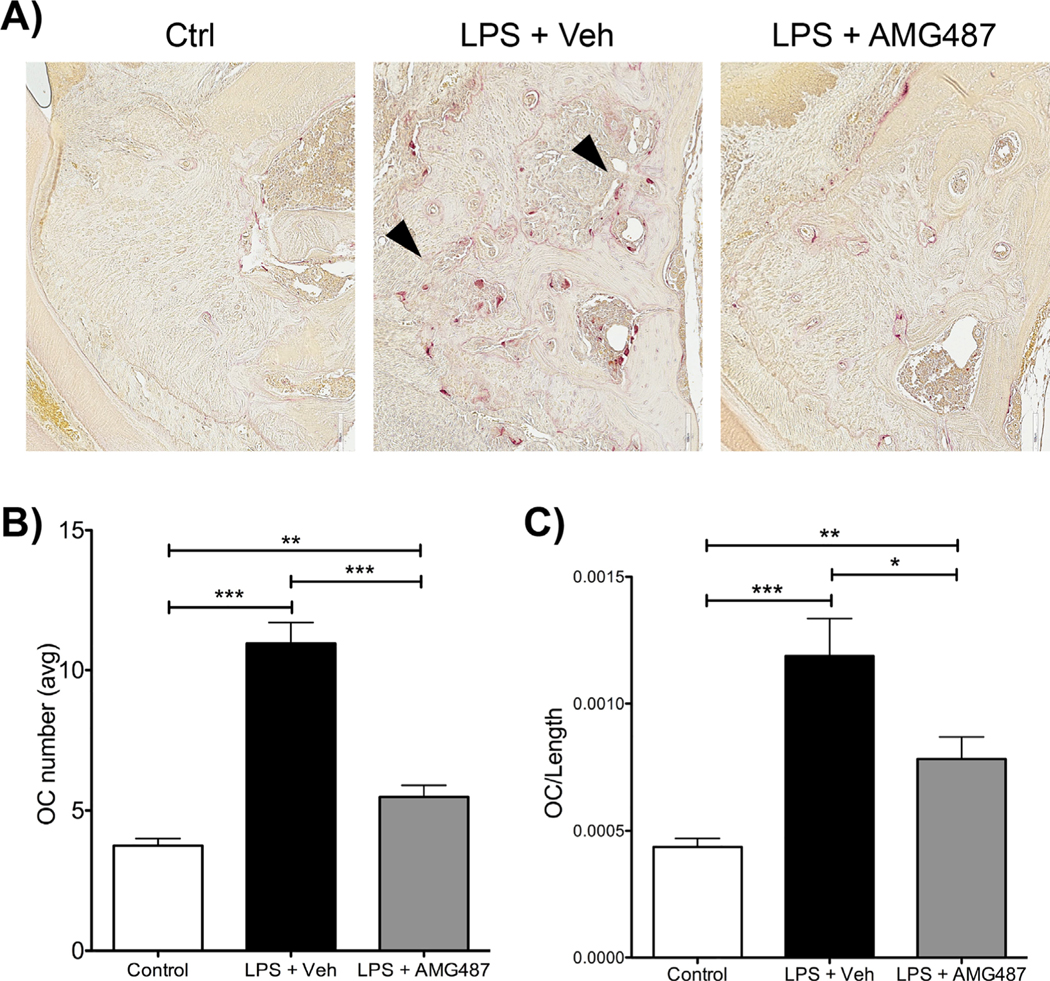
Fig. 7.
Histological assessment of osteoclast numbers after AMG-487 treatment. (A) Tartrate-resistant acid phosphatase (TRAP) staining of control (Ctrl), P.g.-LPS + veh injections and P.g.-LPS + AMG-487 groups. Note the increase in TRAP+ cells in the P.g.-LPS + veh injection group (black arrows). 20 magnification. (B) Graph representing the averaged total number of osteoclasts in control (Ctrl), P.g.-LPS + veh injections, and P.g.-LPS + AMG-487 groups. (C) Graph representing the averaged osteoclast number divided by the alveolar bone length considered in analysis in control (Ctrl), P.g.LPS + veh injections and P.g.-LPS + AMG-487 groups. For both graphs (B, C), significance was compared using a Student’s t test. n ≥ 5 mice/group, p ≤ 0.05*, p ≤ 0.01**, p ≤ 0.001***. Data represented as mean ± standard error of the mean (SEM).

