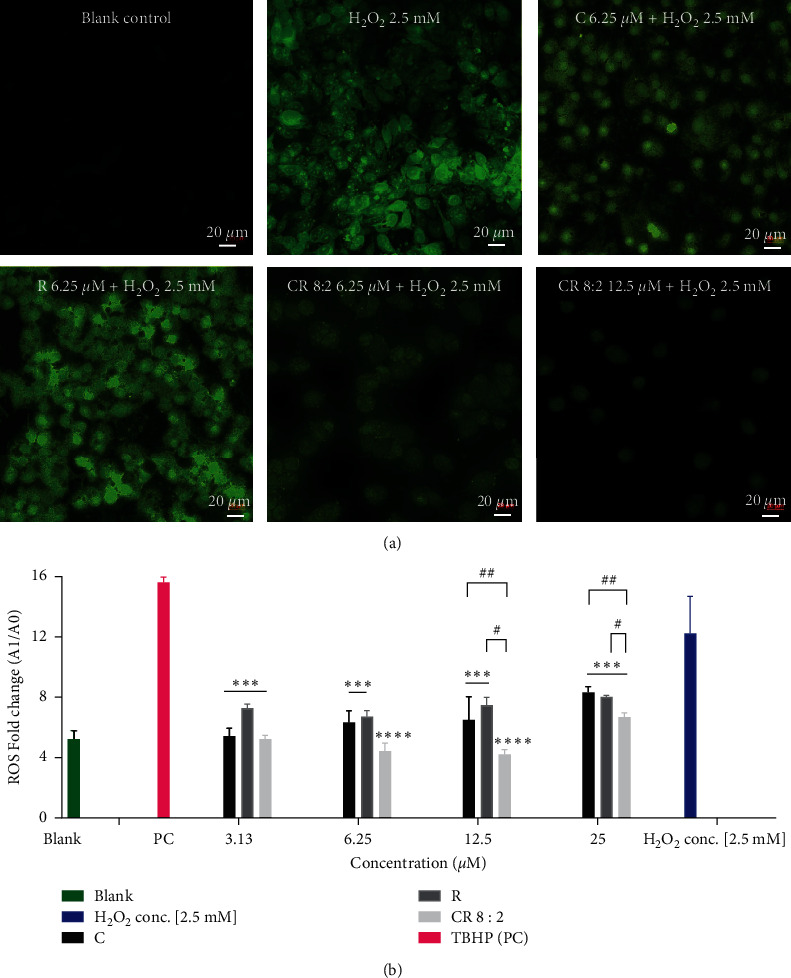
Figure 4.

ROS expression in EAhy926 cells pretreated with C, R, or CR 8 : 2 and stimulated with H2O2 for 4 h. (a) EAhy926 cells were stained with DCFDA (fluorogenic dye) for 1 h and washed and incubated with various treatments for 1 h and stimulated with H2O2 (2.5 mM) for another 4 h. The cells were subjected to a confocal microscope (20x) for the imaging of ROS detection with the filter set of fluor488 using an inverted Leica TCS SP5 laser scanning confocal microscope. (b) EAhy926 cells were stained with DCFDA (fluorogenic dye) for 1 h and washed and incubated with various treatments for 1 h and stimulated with H2O2 (2.5 mM) for another 4 h. The ROS amount was quantified by reading the absorbance on a fluorescence plate reader at Ex/Em = 485/535 nm. ∗∗∗∗p < 0.0001, ∗∗∗p < 0.001 vs. H2O2. #p < 0.05, #p < 0.01 vs. C or R at the same concentration level. TBPH was used as PC (positive control) in this assay. The error bars represent the standard deviation of measurements for three samples in three assay runs (n = 3).
