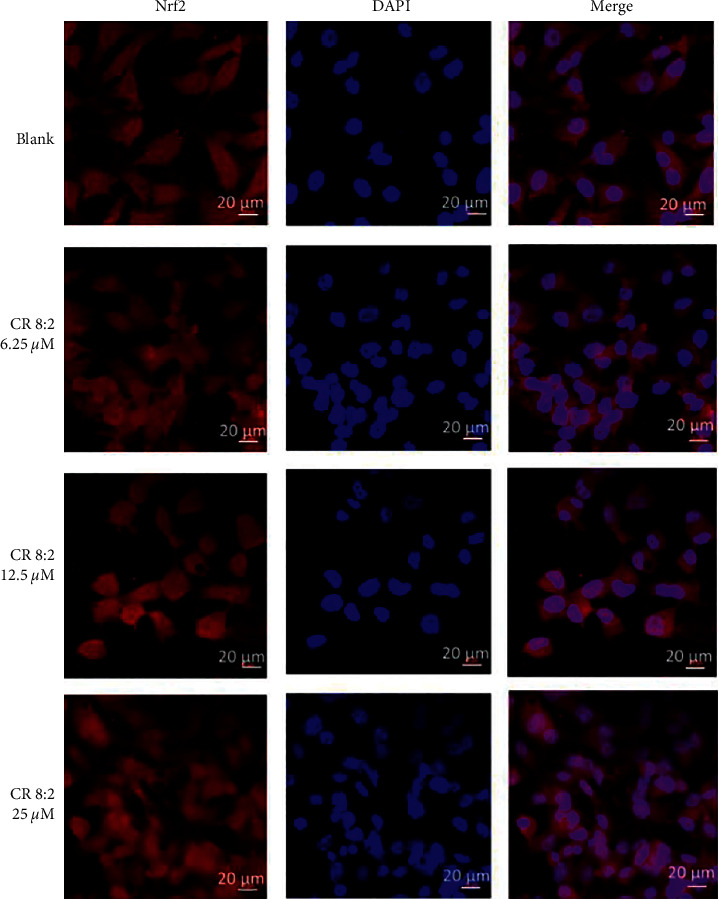
Figure 5.

C, R, and CR 8 : 2 induced Nrf2 translocation in EAhy926 cells (n = 3). Immunofluorescent analysis was performed with an inverted Leica TCS SP5 laser scanning confocal microscope. The red and blue fluorescent indicates the localization of Nrf2 and nucleus (DAPI), respectively. The scale bars represent 20 μm.
