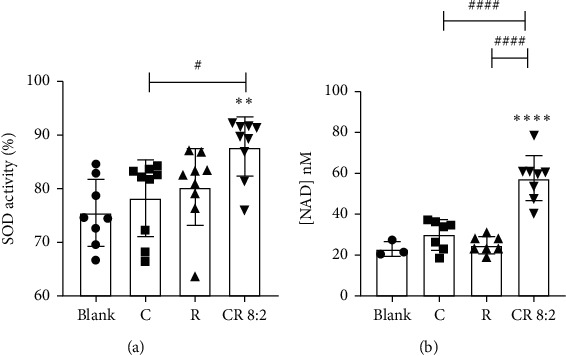
Figure 7.

CR 8 : 2 increased cellular SOD (a) and NAD (nM) (b) productions. ∗∗p < 0.01, ∗∗∗∗p < 0.0001 vs. blank; #p < 0.05, ####p < 0.0001 vs. C or R at the same concentration level (50 μM). The error bars represent the standard deviation of measurements for over three samples in three separate assay runs (n = 3).
