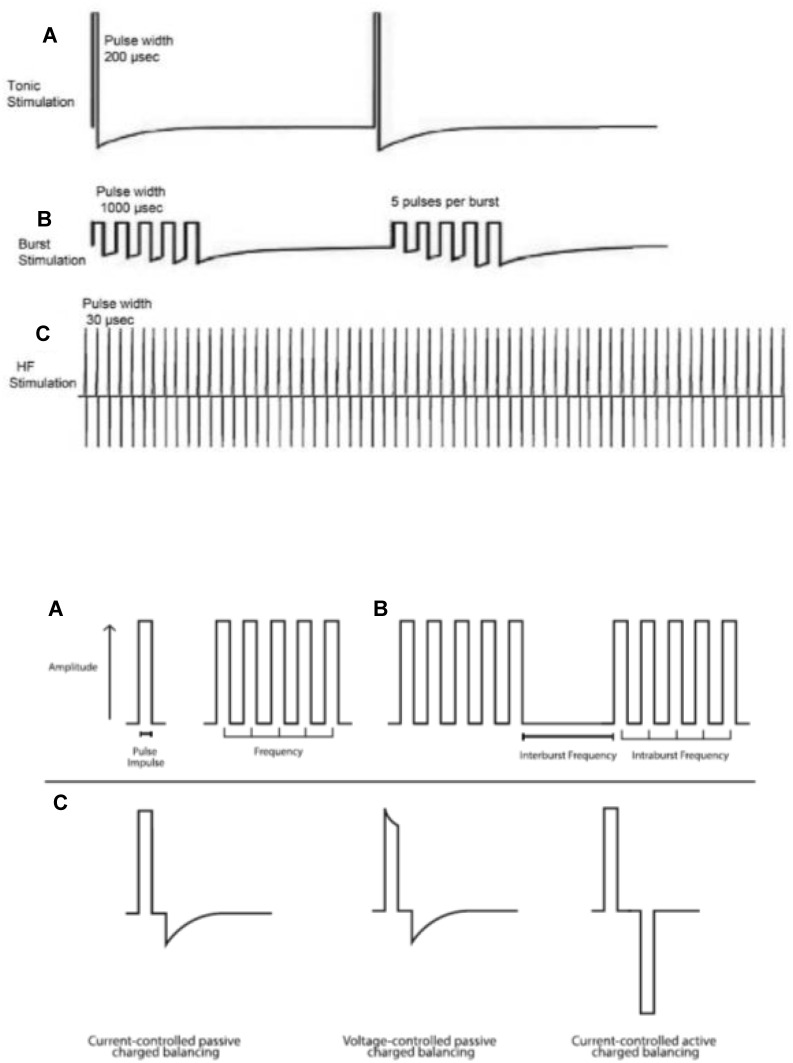
Figure 1.
Top: Waveforms for tonic (A), burst (B), and high-frequency (C) SCS, allowing comparison of relative pulse widths, frequencies, and amplitudes. Reprinted with permission from Reprinted with permission from Taylor and Francis. Ahmed S, Yearwood T, De Ridder D, Vanneste S. Burst and high frequency stimulation: underlying mechanism of action. Expert Rev Med Devices. 2018;15(1):61–70.67 Bottom: Schematic illustrating pulse width, frequency, and burst variables (A and, B), as well as factors that create the electrical properties of a single pulse within a waveform (C). Reproduced from Reproduced from Caylor J, Reddy R, Yin S, et al. Spinal cord stimulation in chronic pain: evidence and theory for mechanisms of action. Bioelectron Med. 2019;5(1):12. Creative Commons license and disclaimer available from: http://creativecommons.org/licenses/by/4.0/legalcode.38

