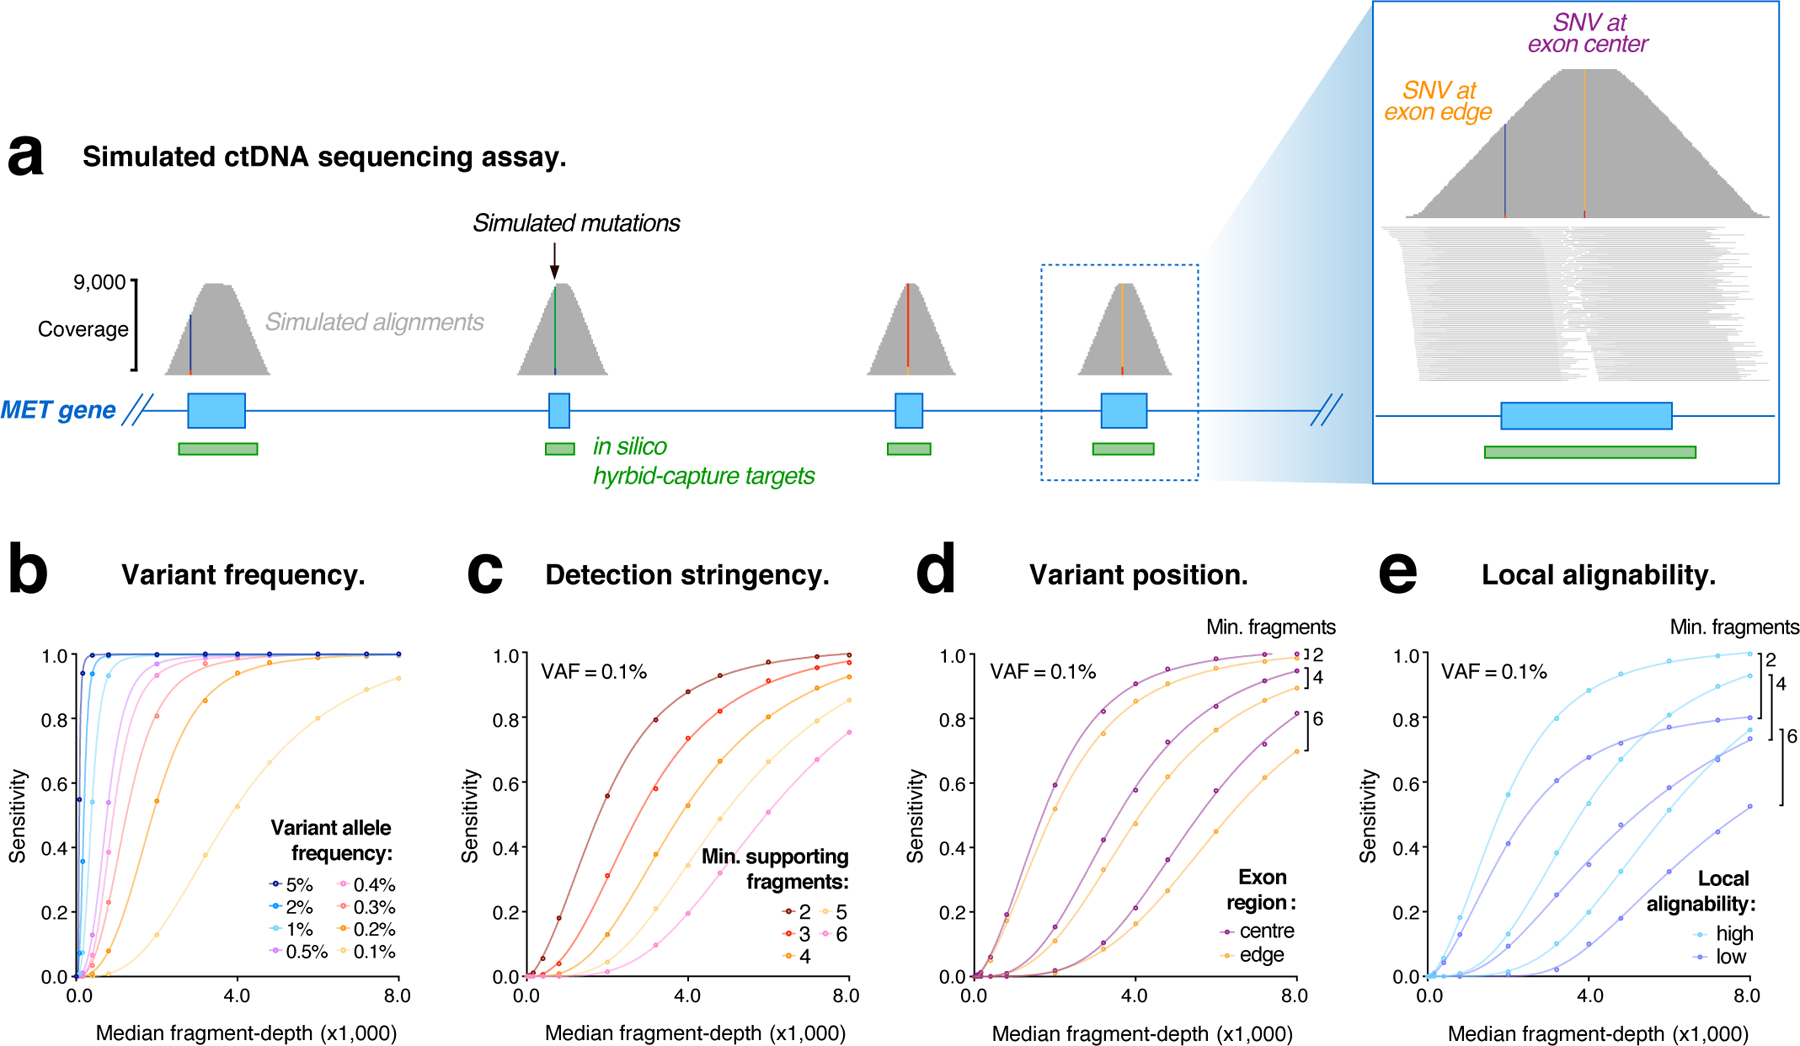
Figure 1. Evaluating ctDNA assays with simulated sequencing data.

(a) Genome browser view showing coverage of simulated sequencing fragments within the MET oncogene, with single nucleotide variants (SNVs) represented in each exon. Inset (right) shows the distribution of fragment coverage within a single coding exon, illustrating the convex coverage profile that results from in silico capture enrichment and causes lower fragment-depth among mutations in edge regions. (b–e) Curves modelling the relationship between simulated library depth (median fragment-depth) and detection sensitivity for simulated mutations under various conditions: (b) shows mutations represented at different frequencies (0.1–5% VAF), with ≥ 4 supporting fragments required for detection; (c) mutations at VAF = 0.1%, with different levels of detection stringency applied (≥ 2–6 supporting fragments); (d) mutations within exon edge regions (< 20bp from exon boundary), compared to central regions (> 50bp from exon boundary); (e) mutations in regions of sub-optimal alignability (low), compared to optimal regions (high).
