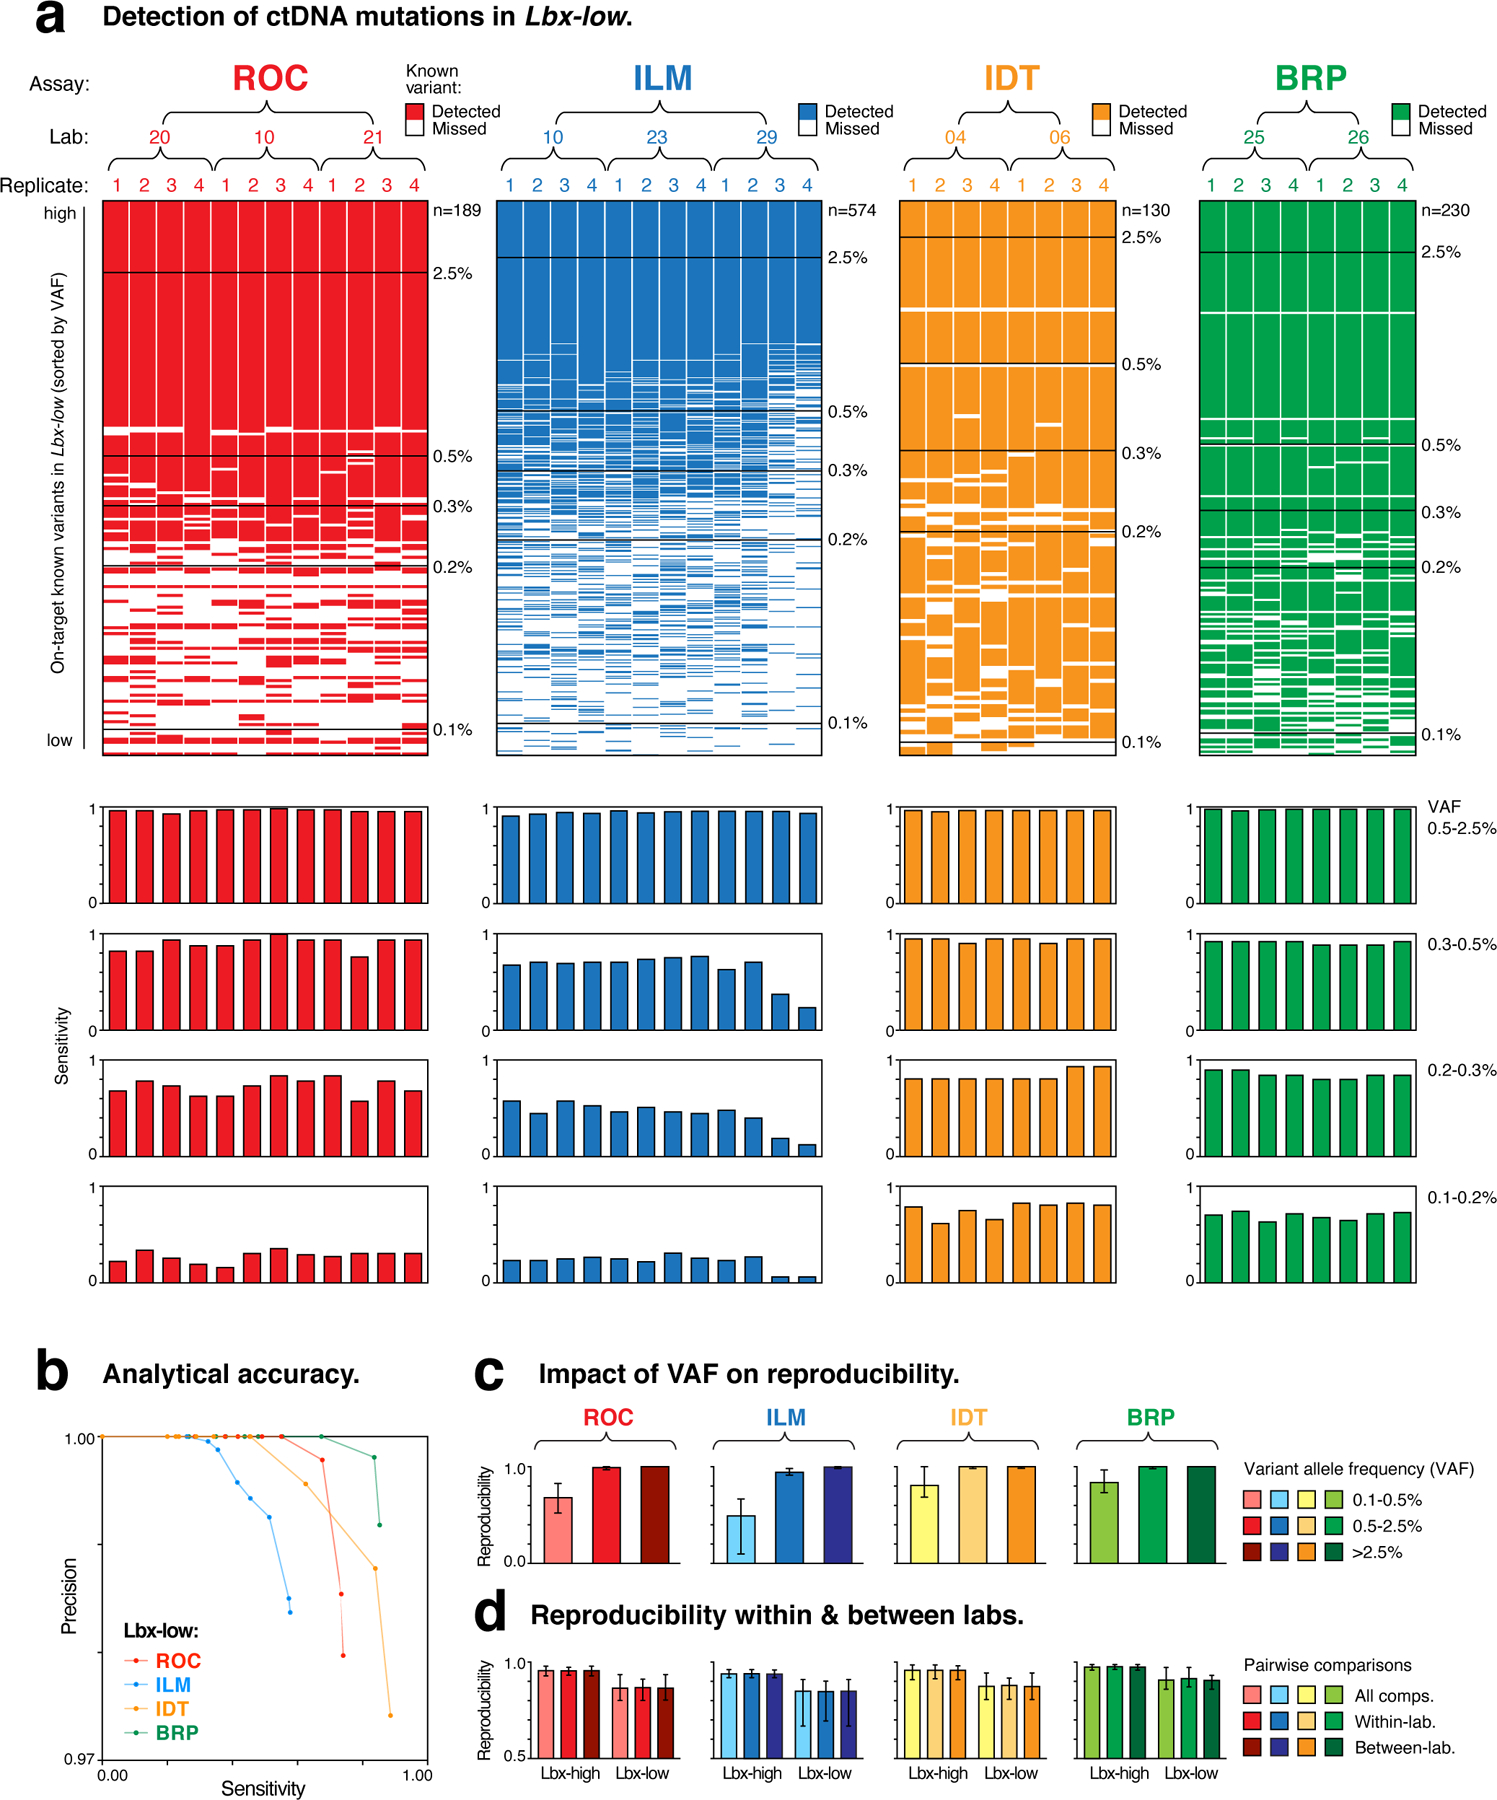
Figure 4. Comparison of performance between hybrid-capture ctDNA assays at 25ng input.

(a; upper) Ordered heatmaps show the detection of known variants (rows) in ctDNA assay replicates (columns). All on-target variants for a given assay are shown. Variants are sorted by expected variant allele frequency (VAF) in descending order, and replicates are arranged hierarchically by assay type, test lab and replicate number. Heatmaps show results for Lbx-low at 25ng input and equivalent heatmaps for Lbx-high are shown in Fig. S4a. (a; lower) Aligned below each heatmap column, bar charts indicate the sensitivity of variant detection in each replicate. Sensitivity is reported separately for known variants in the following VAF ranges: 2.5–0.5%, 0.5–0.3%, 0.3–0.2%, 0.2–0.1%, with measurements taken from both Lbx-high (high- and mid-VAF) and Lbx-low (low-VAF). (b) Precision-recall curves compare diagnostic performance of participating ctDNA assays for Lbx-low (25ng input; VAF range 2.5–0.1%). Equivalent curves for Lbx-high are shown in Fig. S4c. (c,d) Bar charts show pairwise reproducibility scores for participating assays (n = 132 for ROC, ILM; n = 56 for IDT, BRP; median ± range): (c) reproducibility is reported separately for variant candidates at high, mid and low frequency (as above); (d) reproducibility is reported separately for all within-lab and between-lab pairwise comparisons. Note that due to its smaller panel size and VAF distribution of on-target variants the TFS amplicon sequencing assay is not included in these analyses.
