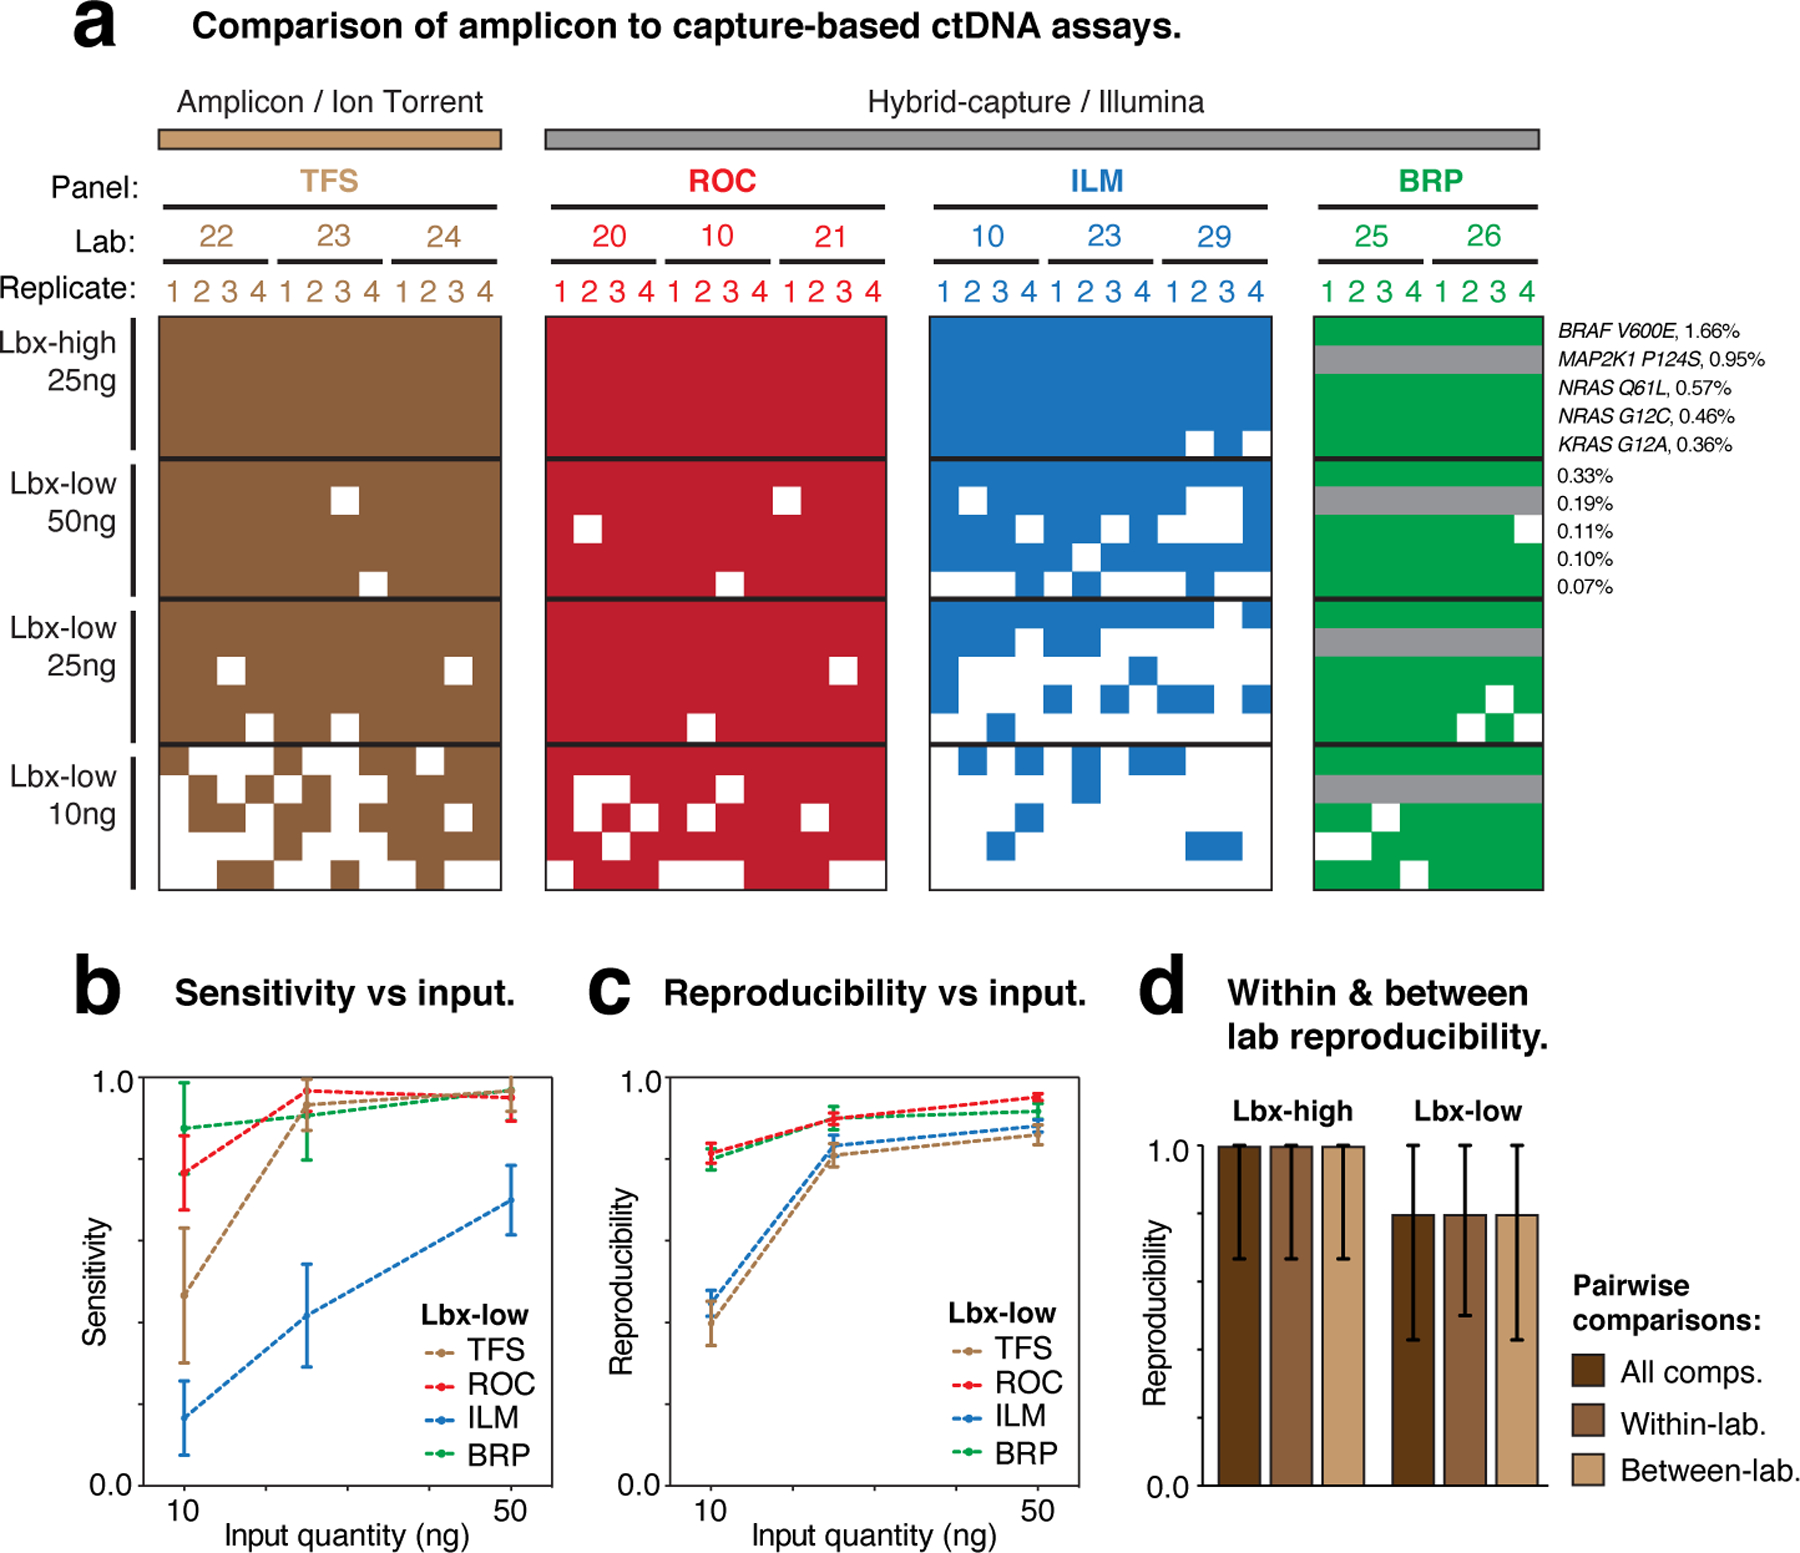
Figure 6. Evaluation of TFS amplicon sequencing assay.

(a) Heatmaps show the detection of known variants (rows) in ctDNA assay replicates (columns). Variants are sorted by expected variant allele frequency (VAF) in descending order for each sample/input quantity (Lbx-high 25ng, Lbx-low 10–50ng), and replicates are arranged hierarchically by assay type, test lab and replicate number. Grey rows indicate where known variant was not within the target regions for a given assay. (b,c) Curves showing the relationship between cell-free DNA input quantity (Lbx-low) and variant detection sensitivity (b) and pairwise reproducibility (c). (d) Bar charts show pairwise reproducibility scores for participating assays (n = 132 for ROC, ILM TFS; n = 56 for BRP; median ± range). Reproducibility is reported separately for all pairwise comparisons in Lbx-high and Lbx-low and separately for all within-lab and between-lab comparisons. Note that the IDT hybrid-capture assay is not included in these comparisons because this panel had limited overlap with TFS amplicon target regions.
