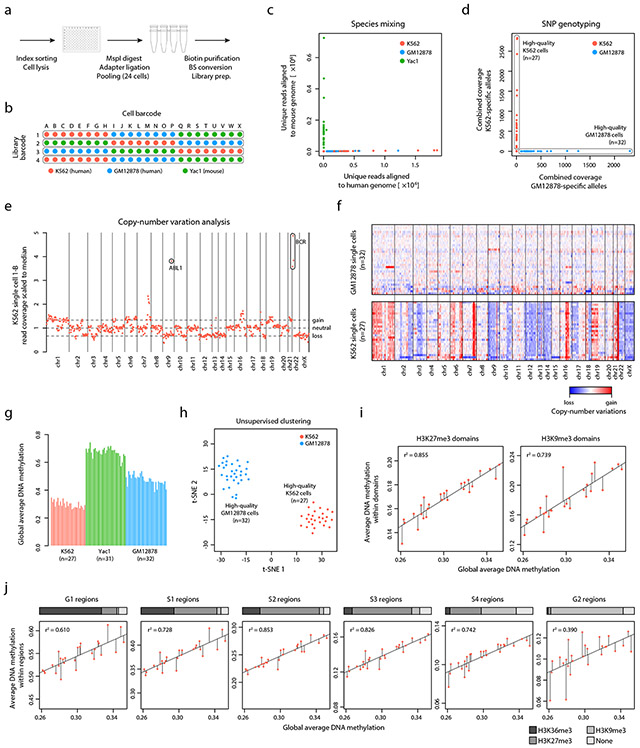
Fig. 5 ∣. Single cell XRBS reveals epigenetic and genetic heterogeneity.
A) Schematic of single cell experimental setup. Cells are sorted into separate barcoding reactions, and then pooled for subsequent bisulfite conversion, hexamer extension, and library amplification.
B) Schematic shows barcoding strategy for 96 single cells from three cell lines (K562 red, GM12878 blue, and Yac1 green) through a combination of 24 single cell barcodes and four library barcodes.
C) Scatterplot shows for each scXRBS profile (dots) the number of reads that align specifically to the mouse genome (x-axis) versus the human genome (y-axis), confirming the absence of cross contamination between human and mouse cells prepared in the same reaction pool.
D) Scatterplot shows for each single K562 or GM12878 cell XRBS profile (dots) coverage of homozygous SNPs specific to K562 (y-axis) or GM12878 (x-axis) cells, confirming the absence of cross contamination between the two human cell lines.
E) Plot shows copy number variations for single K562 cells inferred from XRBS profiles. Amplification of the prototypic BCR-ABL fusion is detected.
F) Heatmap depicts copy number variations inferred for single GM12878 (n=32, top) and K562 cells (n=27, bottom). Single cells are ordered in decreasing read coverage. Single GM12878 cells are largely copy number neutral, while single K562 cells exhibit multiple chromosomal and sub-chromosomal abnormalities.
G) Barplot shows the average genome-wide DNA methylation for high-quality single cell K562, GM12878, and Yac1 profiles.
H) Plot shows t-SNE analysis of pairwise distances between high-quality single cell K562 and GM12878 profiles.
I) Scatterplots compare single cell average DNA methylation within H3K27me3 domains (y-axis, left) and H3K9me3 domains (right) against genome-wide average DNA methylation levels (x-axis). Diagonal lines indicate results from linear regression analysis and residuals for each single cell.
J) Scatterplots compare single cell average DNA methylation within various early and late replicating regions (y-axis) against genome-wide average DNA methylation levels (x-axis). Horizontal bar above each plot shows the fraction of regions associated with active and repressive histone marks (H3K36me3, H3K27me3, and H3K9me3). Diagonal lines indicate results from linear regression analysis and residuals for each single cell.

