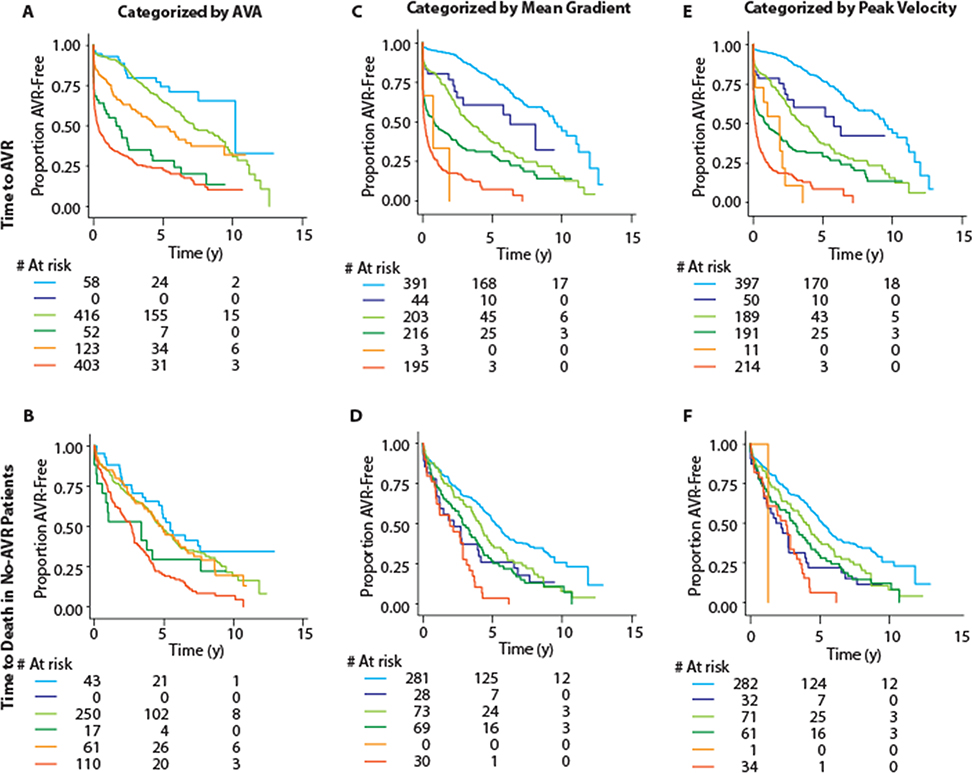
Figure 6. Severity stratification with machine-learning-based groups within prognostic categories of component variables.
Figure shows Kaplan Meier plots for time to AVR (top row) and time to death in no-AVR patients (bottom row). Column-wise, the plots are for categorization based on aortic valve area (A, B), mean gradient (C, D) and peak velocity (E, F). Each of these variables was first trichotomized into mild, moderate and severe categories based on recommended cutoffs (>1.5, 1.0-<1.5 and <1.0 cm2 for aortic valve area; <20, 20-<40 and ≥40 mmHg for mean gradient; and <3, 3-<4 and ≥4 m/s for peak velocity). TDA-based phenogroups were the used to stratify within each of these categories. In all panels, the mild category is represented by blue color (stratified as light blue for low-severity and dark blue for high-severity), moderate category is indicated by green color (stratified as light green for low-severity and dark green for high-severity) and the severe category is represented by orange color (stratified as light orange for low-severity and dark orange for high-severity). As can be seen, TDA-based phenogroups continued to stratify patients within the prognostically defined categories of the component variables. Abbreviations as in Figures 1 and 4.

