
Figure 4.
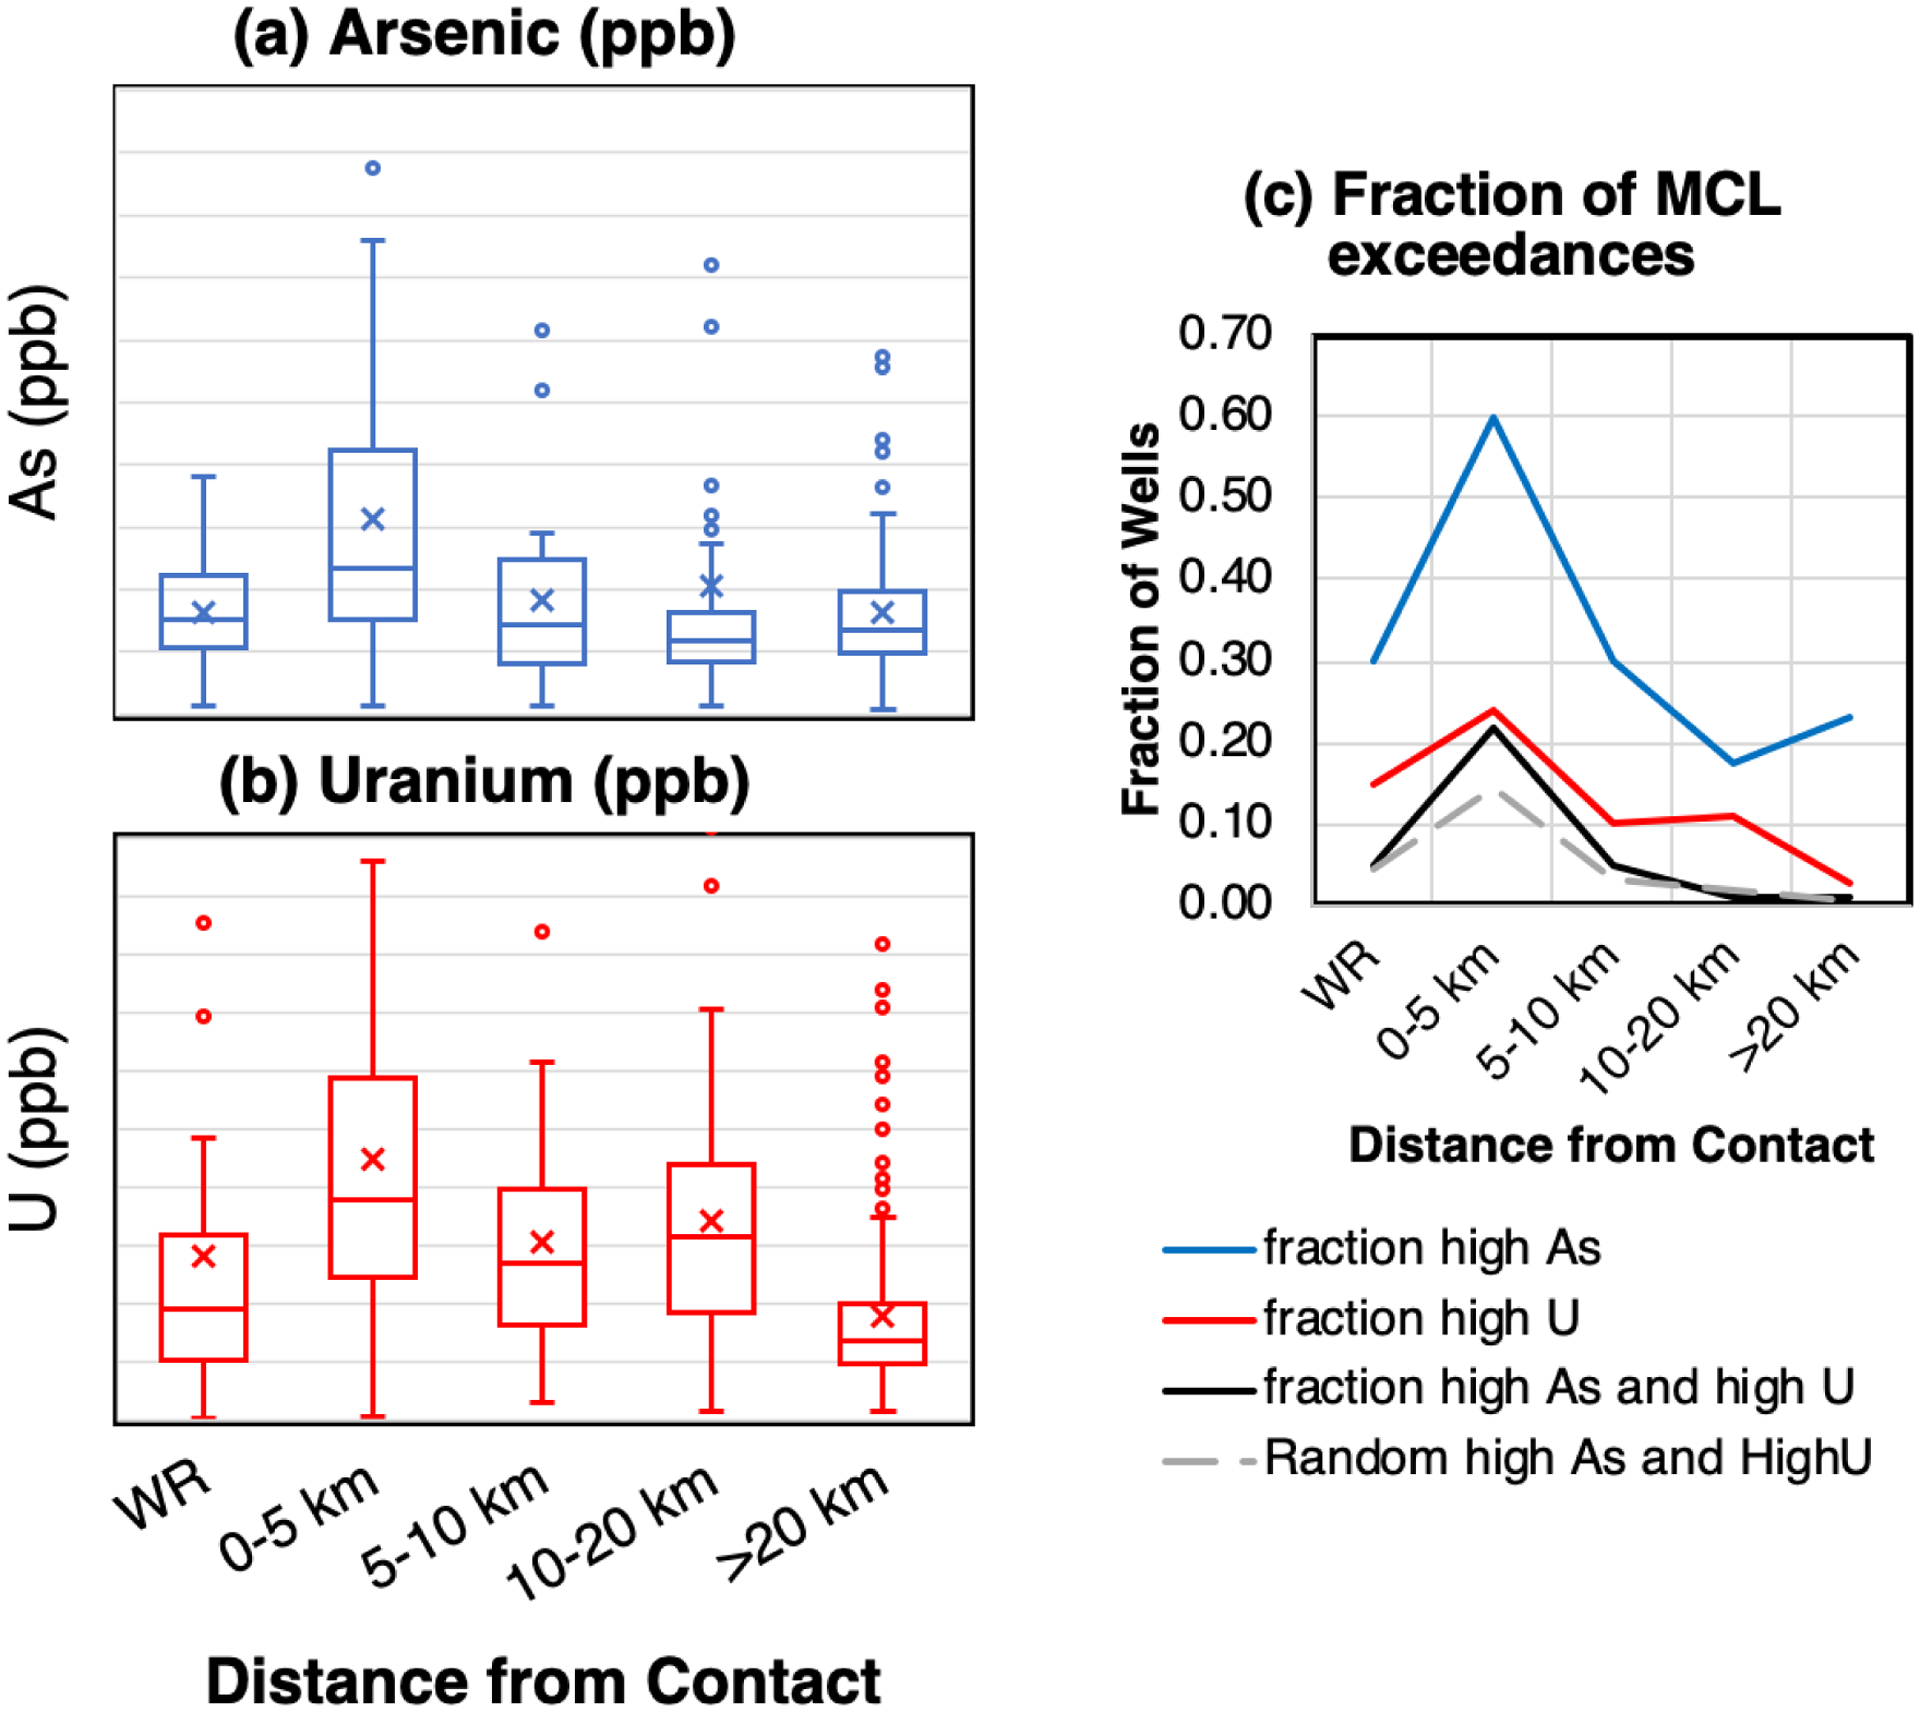
The relationship between arsenic (a) and uranium (b) well water concentrations and the location of the well relative to the contact of the Arikaree and White River formations. Distance ranges are for wells in the White River formation (WR, NW of the contact), 0–5, 5–10, 10–20 and >20 km (SE of the contact, upgradient and largely in the Arikaree formation. Arsenic and uranium concentrations are higher within the Arikaree Formation near the White River formation, leading to higher levels of exceedances of arsenic and uranium MCLs (10 and 30 ppb respectively) (c). The predicted random distribution (gray in panel c) is determined by the product of arsenic and uranium probabilities. For most distances, the random and observed distributions are similar, but at the contact the observed probability of a well being contaminated with both arsenic and uranium is nearly double the ratio predicted based on random distribution.