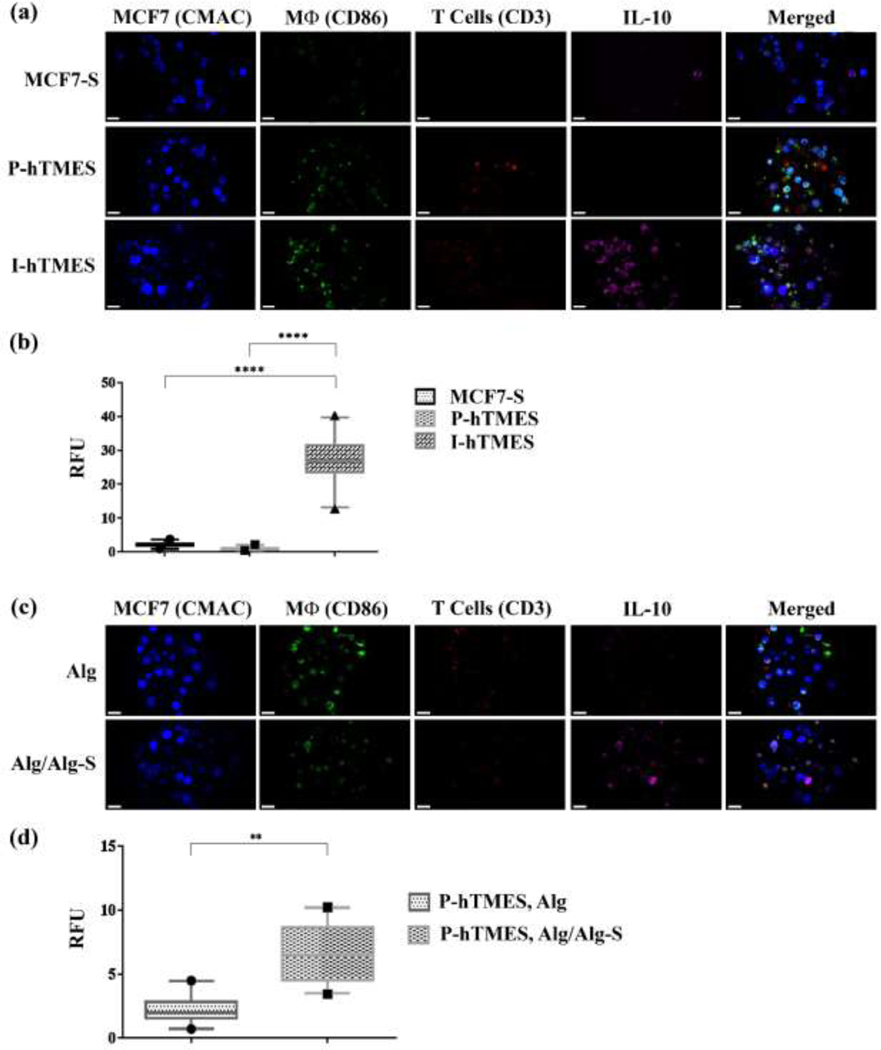
Fig. 7. On-chip analysis of IL-10 expression in MCF7-S, P-hTMES and I-hTMES.
On-chip immunofluorescence for IL-10 expression (magenta); T cells immunolabeled for CD3 (red); macrophages immunolabeled for CD86 (green); and MCF7 labeled with live-cell tracker CMAC (blue). (a) Confocal immunofluorescence imaging of IL-10 expression in MCF7-S, P-hTMES and I-hTMES. (b) Quantitative analysis of IL-10 expression conducted by measuring IL-10 fluorescence intensity vs. background, in n=30 scaffolds for each scaffold type, expressed in relative fluorescence units (RFU). Statistical analysis was conducted for means of fluorescence intensity, using one-way ANOVA, with p ≤ 0.05 considered statistically significant. (c) IL-10 imaging in P-hTMES, encapsulated in Alg (upper panel) or Alg/Alg-S (lower panel), with labeling the same as described in (a). (d) Quantitative analysis of IL-10 production in the P-hTMES following 5 days of incubation was conducted as described in (b), with statistical analysis conducted by using two-tailed Student’s T-test, with p ≤ 0.05 considered statistically significant, in n=20 scaffolds. Box plots are depicted as the 5–95 percentile, where the whiskers show the data range within this percentile, the box denotes the values in the 25th to the 75th percentiles, and the horizontal bar depicting the median. The dots bellow and above the whiskers denote the min and max values measured. Imaging was conducted by Zeiss LSM 880 confocal microscopy, using 20X magnification, 2 μm Z-stacking. Scale bar in (a) and (c) = 20 μm.

