Fig. 3.
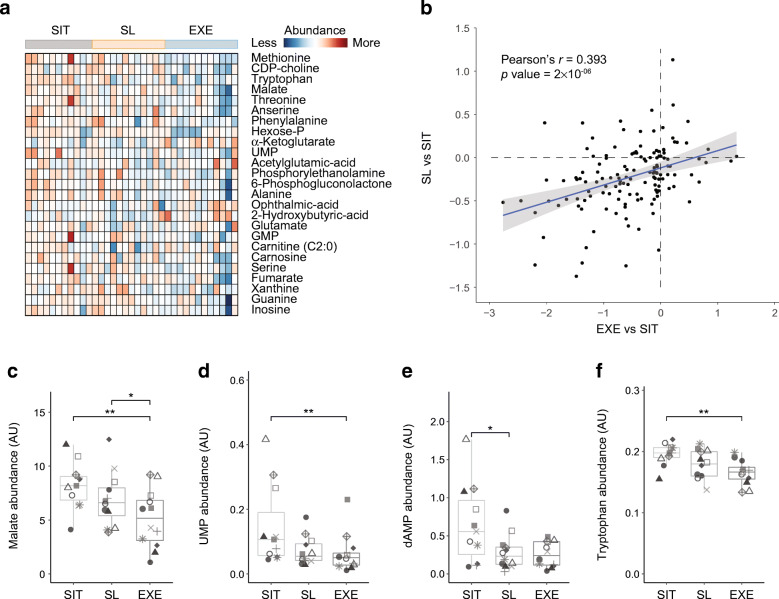
Responses to sitting less are similar to those produced by exercise at the molecular metabolic level in skeletal muscle. Regimens for sitting, sitting less and exercise are denoted as SIT, SL and EXE, respectively. Metabolomics analyses were performed in skeletal muscle biopsy samples of participants (n = 11). Heatmap and box plots show stepwise metabolite abundance changes going from SIT to SL to EXE. (a) Heatmap of the top 25 metabolites, ranked by their VIP scores from the PLS-DA (ESM Fig. 1a). Relative abundance levels in each participant per regimen is scaled from low abundance (blue) to high abundance (red). (b) Comparison of the significance of differences that EXE induces (compared with sitting), relative to differences induced by SL (compared with sitting). Units on the axes are p values on a −log10 scale. Directionality of induced changes are represented as either negative values (decreased) or positive values (increased). Pearson’s r = 0.393, p = 2 × 10⁻⁶. (c–f) The metabolomic shift induced by SL and EXE is illustrated for malate (c), uridylic acid (d), deoxyadenosine monophosphate (e) and tryptophan (f). Data are shown by boxplots in which each participant is represented by a particular symbol throughout the figure. Significance was determined using an empirical Bayes moderated t test in a linear model framework. *p < 0.05 and **p < 0.01. AU, arbitrary units; CDP-choline, cytidine 5′-diphosphocholine; dAMP, deoxyadenosine monophosphate; Hexose-P, hexose phosphate; UMP, uridylic acid. Boxplots: box includes the IQR corresponding to 25th percentile (Q1, bottom of box), 50th percentile (Q2, bold line within box, i.e. the median) and 75th percentile (Q3, top of box) of the data. The bottom whisker is set at Q1 – 1.5 × IQR and the top whisker at Q3 + 1.5 × IQR

