
Figure 6. Comparison of PTC in the P7A7 map (A) and an assembly intermediate, E4, determined by Davis and Tan, et al. (B).
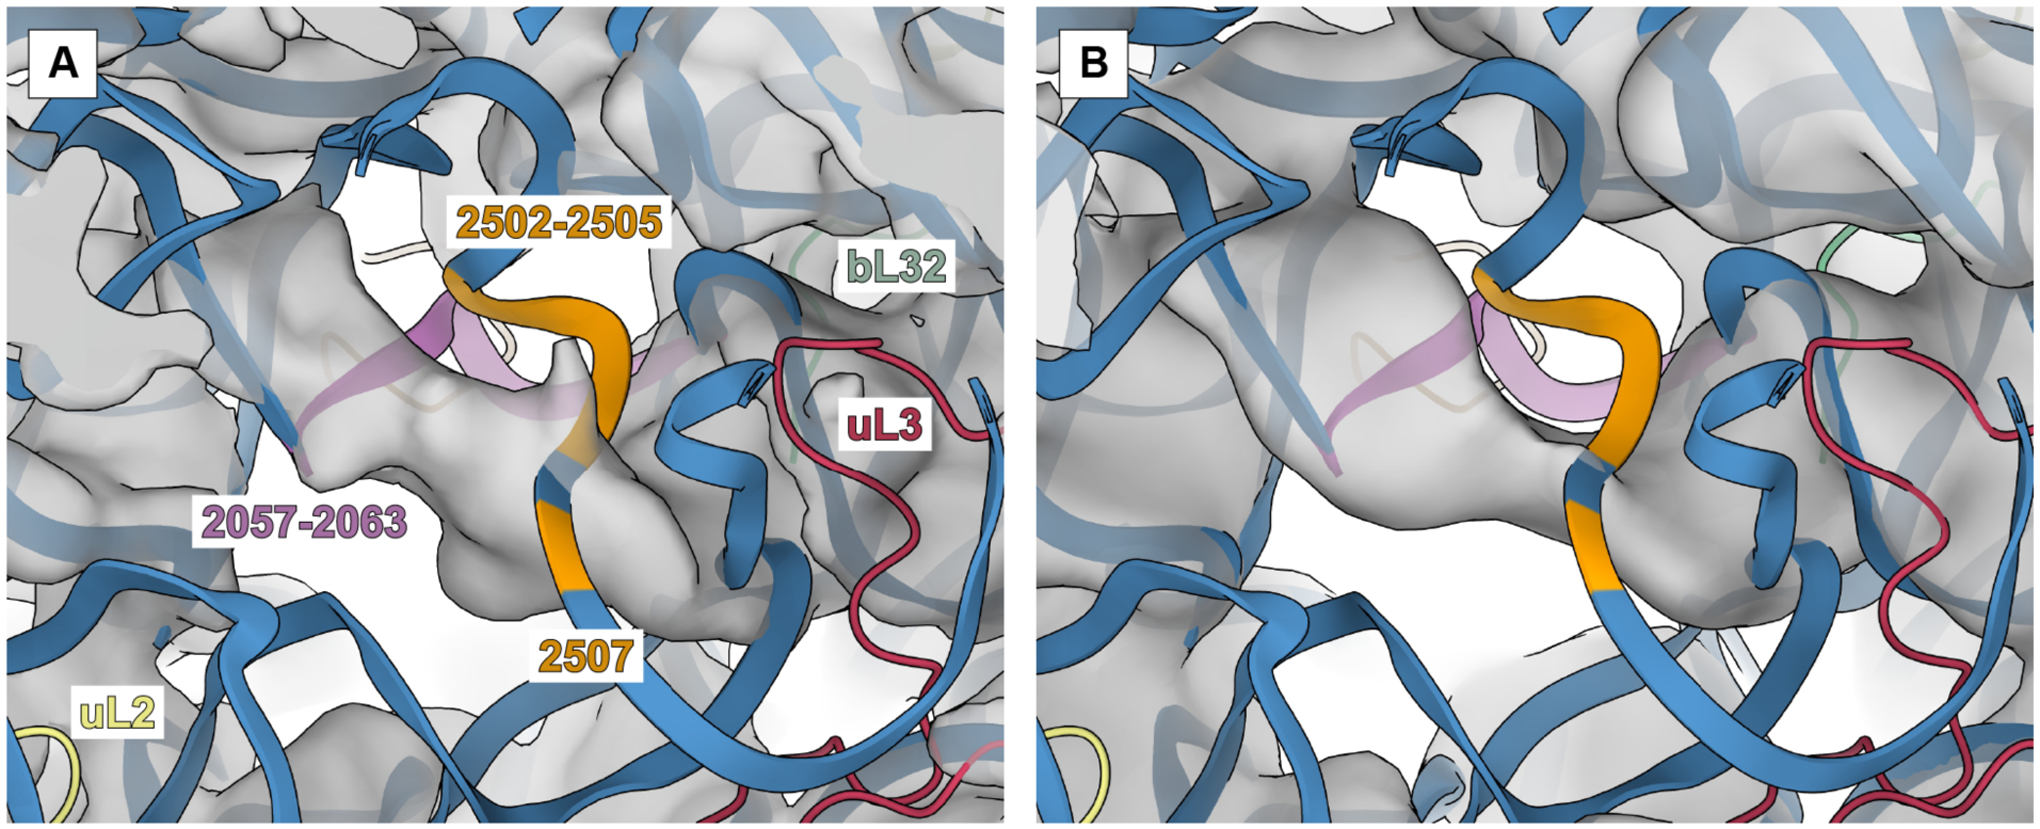
Both maps show helical density that does not appear in fully assembled WT structures. P7A7 mutations regions 2057–2063 and 2502–2505, 2507 are colored in pink and orange, respectively. Other 23S rRNA regions are in blue, and nearby proteins uL2, uL3, and bL32 are yellow, red, and green, respectively.