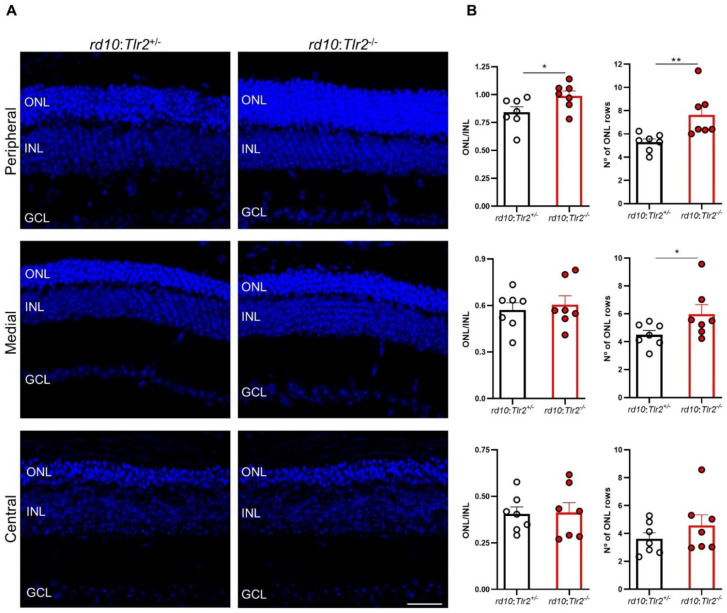
Figure 4.
Retinal structure analysis of rd10:Tlr2+/− and rd10:Tlr2−/− mice. (A) Representative images of peripheral, medial, and central retinal areas in cryosections from rd10:Tlr2+/− and rd10:Tlr2−/− mice at P36. Nuclei were stained with DAPI (blue). ONL, outer nuclear layer; INL, inner nuclear layer; GCL, ganglion cell layer. Scale bar, 31 μm. (B) ONL and INL thickness was measured in equatorial sections corresponding to the peripheral, medial, and central retina (see Methods section). The number of photoreceptor rows was scored in the same regions. Dots represent individual mice, and bars represent the mean (+SEM) for each group. n = 7 animals per group, (5 sections per retina, 2 images per section in each area, 3 measurements per image). ** p < 0.01; * p < 0.05 (unpaired t-test for normally distributed data (ONL/INL ratio); Mann–Whitney U-test for non-normally distributed data (number of ONL rows)).

