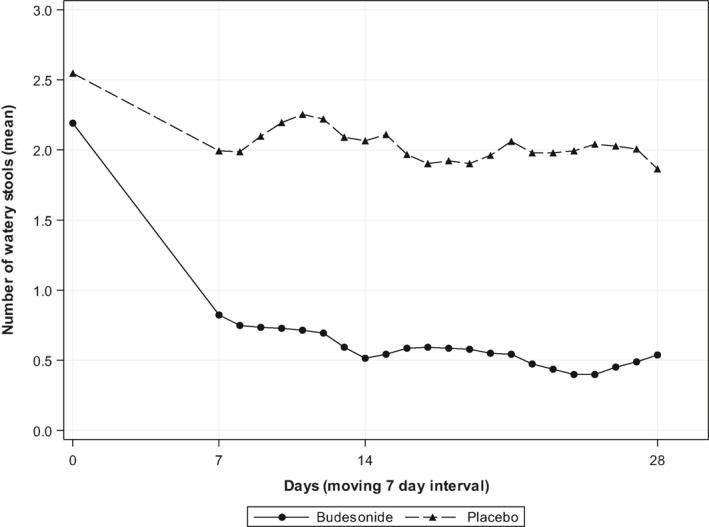
FIGURE 3.

Mean number of watery stools/day during the first 28 days (intention‐to‐treat population). A data point reflects the mean number of watery stools per day during the preceding 7 days

Mean number of watery stools/day during the first 28 days (intention‐to‐treat population). A data point reflects the mean number of watery stools per day during the preceding 7 days