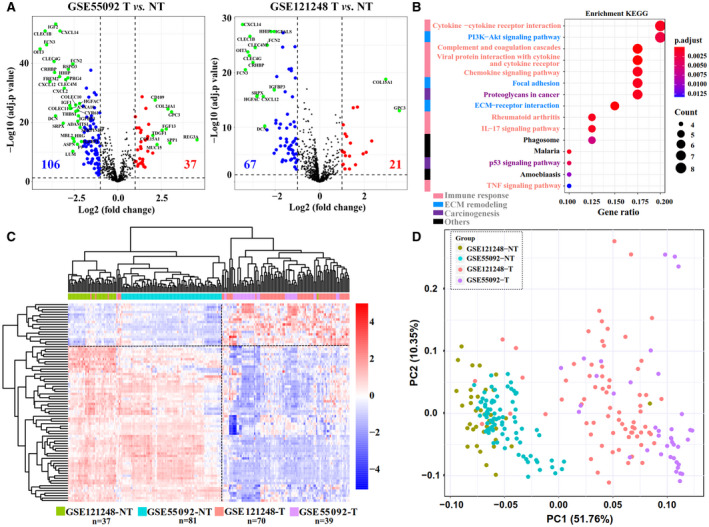
FIG. 1.

Abnormal matrisome gene expression during HBV‐related hepatocarcinogenesis. (A) Volcano plots of the HHMGs in the GSE55092 and GSE121248 data sets. Volcano plots were drawn using the ggplot2 R package (https://CRAN.R‐project.org/package=ggplot2). Blue indicates down‐regulation and red indicates up‐regulation. The most significant HHMGs are highlighted in green in the volcano plots under an extreme cutoff criterion (log10‐transformed [adjusted P] > 10 and fold change >4). (B) Significantly enriched KEGG pathways of the identified HHMGs. The size of the circle represents the gene number, and the color represents adjusted P value. An adjusted P < 0.05 was considered statistically significant. (C) Heatmap of the expression of the HHMGs in the merged liver samples from the GSE55092 and GSE121248 data sets. Log2‐transformed gene‐expression levels were scaled as a distribution with mean = 0 and SD = 1. The darker the blue, the lower the expression; the darker the red, the higher the expression. Both the row HHMGs and the column samples were clustered by HCL analysis with the average linkage method and “euclidean” as a distance metric. Tumor and nontumor samples from the GSE55092 and GSE121248 data sets are color‐coded. (D) PCA plot of all tumor and nontumor samples from the GSE55092 and GSE121248 data sets. Grouped samples are labeled with different colors. Abbreviations: NT, nontumor; T, tumor; TNF, tumor necrosis factor.
