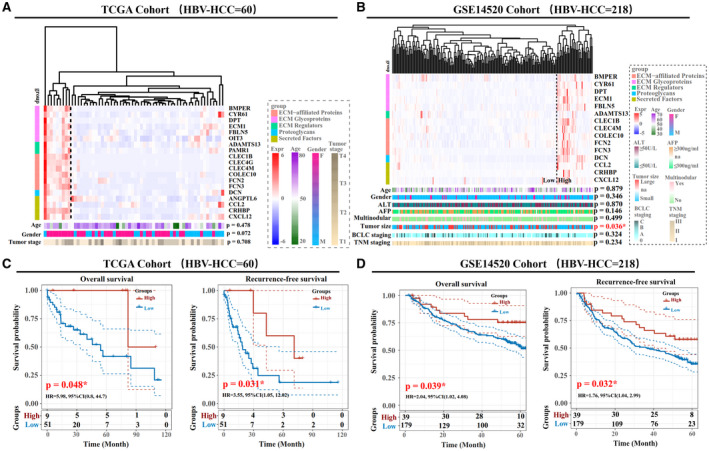
FIG. 4.

Clinical characteristics of HBV‐related HCC subgroups in the TCGA and GSE14520 cohorts. Heatmap of HBV‐related HCC subgroups in the TCGA (A) and GSE14520 (B) cohorts. The column patients were clustered by HCL analysis, with the average linkage method and “euclidean” as a distance metric. The matrisome category of HHMGs highly correlated with each other, and the clinical parameters of each patient with HCC are color‐coded. Log2‐transformed gene‐expression levels were scaled as a distribution with mean = 0 and SD = 1. The darker the blue, the lower the expression; the darker the red, the higher the expression. Overall survival and recurrence‐free survival analyses of the two subgroups (high and low expression) in the independent TCGA (C) and GSE14520 (D) cohorts. The statistical significance of the differences was determined by log‐rank test. *P < 0.05 was statistically significant. Abbreviations: ADAMTS13, ADAM metallopeptidase with thrombospondin type 1 motif, 13; ANGPTL6, angiopoietin‐like 6; BMPER, BMP binding endothelial regulator; CCL2, chemokine (C‐C motif) ligand 2; CLEC1B, C‐type lectin domain family 1, member B; CLEC4G, C‐type lectin domain family 4, member G; CLEC4M, C‐type lectin domain family 4, member M; COLEC10, collectin sub‐family member 10; CRHBP, corticotropin releasing hormone binding protein; CXCL12, chemokine (C‐X‐C motif) ligand 12; CYR61, cellular communication network factor 1 (CCN1); DCN, decorin; DPT, dermatopontin; ECM1, extracellular matrix protein 1; FBLN5, fibulin 5; FCN2, ficolin (collagen/fibrinogen domain containing lectin) 2; FCN3, ficolin (collagen/fibrinogen domain containing) 3; HR, hazard ratio; na, data lacking; OIT3, oncoprotein induced transcript 3; PAMR1, peptidase domain containing associated with muscle regeneration 1.
