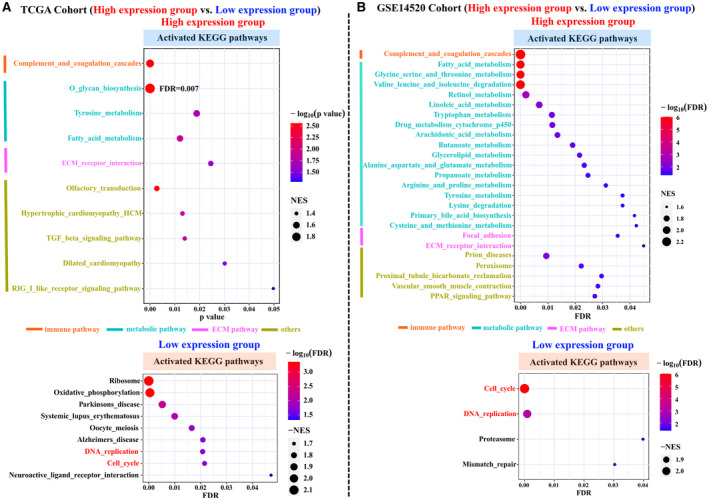
FIG. 5.

Functional comparison between two subgroups of patients with HBV‐related HCC. GSEA analysis of two HBV‐related HCC subgroups (high and low expression) in both the TCGA (A) and GSE14520 (B) cohorts. Significant activated KEGG pathways are shown in the dot plots. The size of the circle represents the NES, and the color indicates the P value or adjusted P value. The KEGG categories are color‐coded. Abbreviations: FDR, false discovery rate; NES, normalized enrichment score; PPAR, peroxisome proliferator‐activated receptor; TGF, transforming growth factor.
