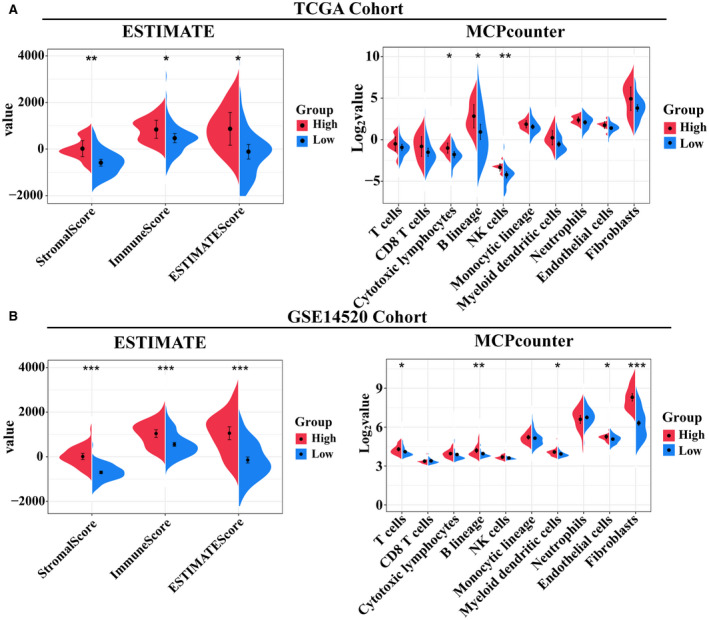
FIG. 6.

Comparison of the tumor purity between the two subgroups of patients with HBV‐related HCC. Violin plots of the StromalScore, ImmuneScore, ESTIMATEScore, and abundance of the immune or stromal cell populations in two subgroups of HBV‐related HCC from the TCGA (A) and GSE14520 (B) cohorts. The statistical difference was calculated with the Kruskal–Wallis test, and the P values are indicated above each violin plot with asterisks (*P < 0.05, **P < 0.01, and ****P < 0.001). Abbreviation: NK, natural killer cell.
