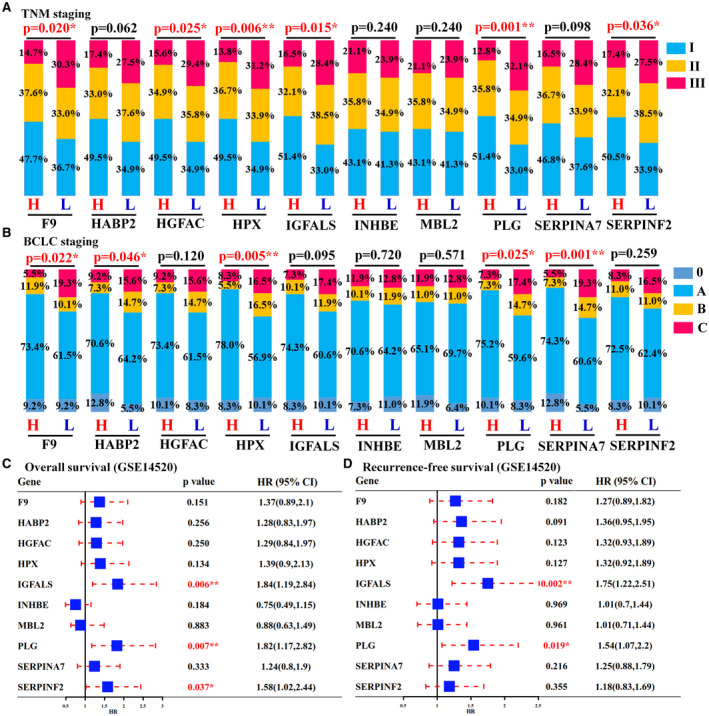
FIG. 7.

Liver‐specific HHMGs and their clinical relevance. TNM (A) and BCLC (B) staging comparisons between the high (H) and the low (L) expression groups. TNM or BCLC staging is shown as percentage. Statistical comparison was performed using chi‐square test (*P < 0.05 and **P < 0.01). Overall (C) and recurrence‐free (D) survival analyses of each liver‐specific HHMGs between the high‐expression and low‐expression groups. Comparisons between the two groups were performed using log‐rank test (*P < 0.05 and **P < 0.01). Abbreviation: HR, hazard ratio.
