. 2021 Sep 15;22(9):718–732. doi: 10.1631/jzus.B2000544

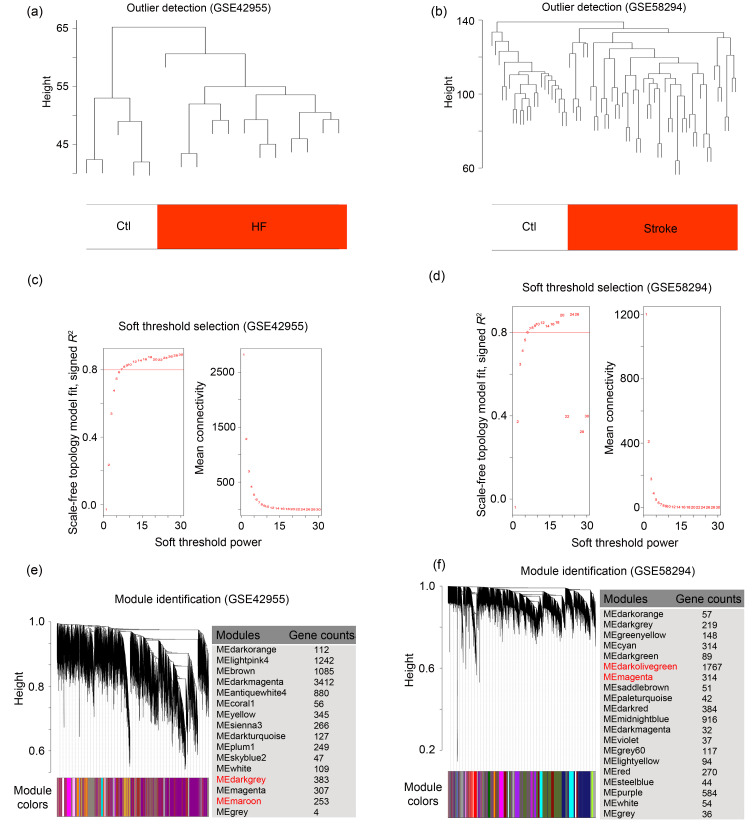
Fig. 2. Weighted co-expression network construction in HF- and stroke-related datasets. (a, b) Clustering dendrograms of samples to detect outliers based on their Euclidean distance. One branch represents a sample, and red marks distinguish the groups of samples. (c, d) Analysis of network topology for various soft thresholds (β). The left panel shows the scale-free fit index (scale independence, y-axis) as a function of the soft threshold power (x-axis); the right panel displays the mean connectivity (degree, y-axis) as a function of the soft threshold power (x-axis). (e, f) Gene dendrograms obtained by average linkage hierarchical clustering. The colored row underneath the dendrogram shows the module assignment determined by the Dynamic Tree Cut. Ctl: control; HF: heart failure; ME: module eigengene.

Fig. 2