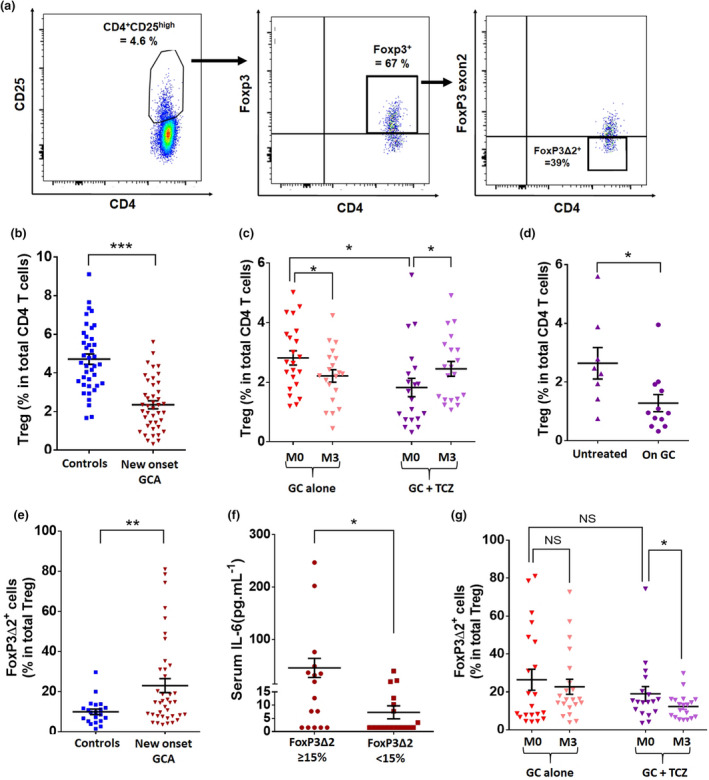
Figure 1.

Decreased Treg frequency in GCA is corrected by treatment with TCZ + GC but not with GC. (a) Flow cytometric analysis of Treg cells. Treg are defined as CD4+CD25highFoxP3+. In this example of a new‐onset GCA patient, CD4+CD25high cells accounted for 4.6% of total CD4+ T cells. When gated on CD4+CD25high cells, 67% expressed FoxP3, so that Treg cells accounted for 3.08% of total CD4+ T cells. Among these Treg, 39% were deficient in exon 2 of FoxP3 (FoxP3Δ2 Treg). (b, c) Percentage of Treg in new‐onset GCA patients (n = 43) and controls (n = 40) (b) and their assessment at baseline (M0) and after treatment (M3): GC alone (n = 23) and GC and TCZ (n = 20). (d) Percentage of Treg at baseline in patients of the GC + TCZ group: at blood sampling, 12 had already received prednisone for a few days and eight were free of prednisone. (e) Percentage of Treg with an isoform of FoxP3 lacking exon 2 (FoxP3Δ2) in new‐onset GCA patients (n = 39) and controls (n = 21). (f) Serum IL‐6 (pg mL–1) in GCA patients depending on the percentage of circulating FoxP3Δ2 Treg at baseline (n = 34). (g) Percentage of FoxP3Δ2 Treg at baseline (M0) and after treatment (M3): GC alone (n = 21) and GC and TCZ (n = 18). Horizontal bars show the mean, error bars show the SEM, and P is the result of Student's t‐tests or paired Student's t‐tests, as appropriate. NS, not significant. *P < 0.05; **P < 0.01; and ***P < 0.001.
