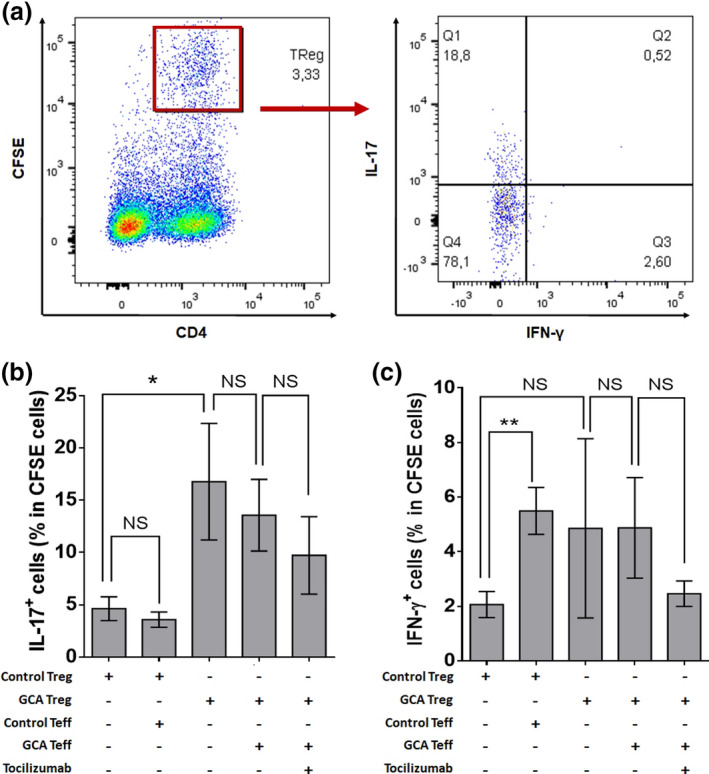
Figure 4.

Assessment of the plasticity of circulating Treg. (a) Flow cytometric study of the Treg (CD4+CFSE+) production of IL‐17 and IFN‐γ. (b, c) Percentage of IL‐17+ Treg (b) and IFN‐γ+ Treg (c) when cultivated alone or in the presence of GCA or control Teff and/or TCZ (5 µg mL−1): control Treg (n = 14), control Treg and control Teff (n = 14), GCA Treg (n = 15), GCA Treg and GCA Teff (n = 16) and GCA Treg, GCA Teff and TCZ (n = 9). Histograms show the mean ± SEM, and P is the result of Student's t‐tests or paired Student's t‐tests, as appropriate. NS, not significant. *P < 0.05 and **P < 0.01.
