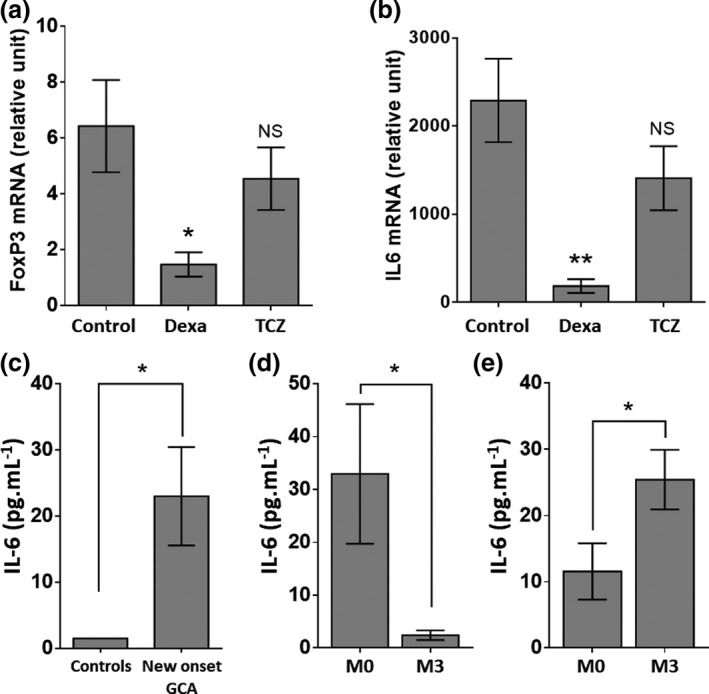
Figure 5.

(a, b) FoxP3 (a) and IL‐6 (b) expressions in ex vivo cultures of temporal arteries (n = 13). Measures were performed after 5 days of culture in Matrigel with polyclonal IgG (control, n = 13), dexamethasone (0.5 µg mL−1, n = 7) or TCZ (10 µg mL−1, n = 10). RT‐PCR results are expressed in relative units with respect to GUSB expression (relative expression). (c–e) Assessment of serum IL‐6 in GCA patients (n = 43) and controls (n = 23) (c) and comparison of the IL‐6 concentration at baseline (M0) and after 3 months of treatment (M3): GC alone (n = 23) (d) and GC + TCZ (n = 20) (e). Histograms show the mean ± SEM, and P is the result of paired Student's t‐tests. NS, not significant. *P < 0.05 and **P < 0.01.
