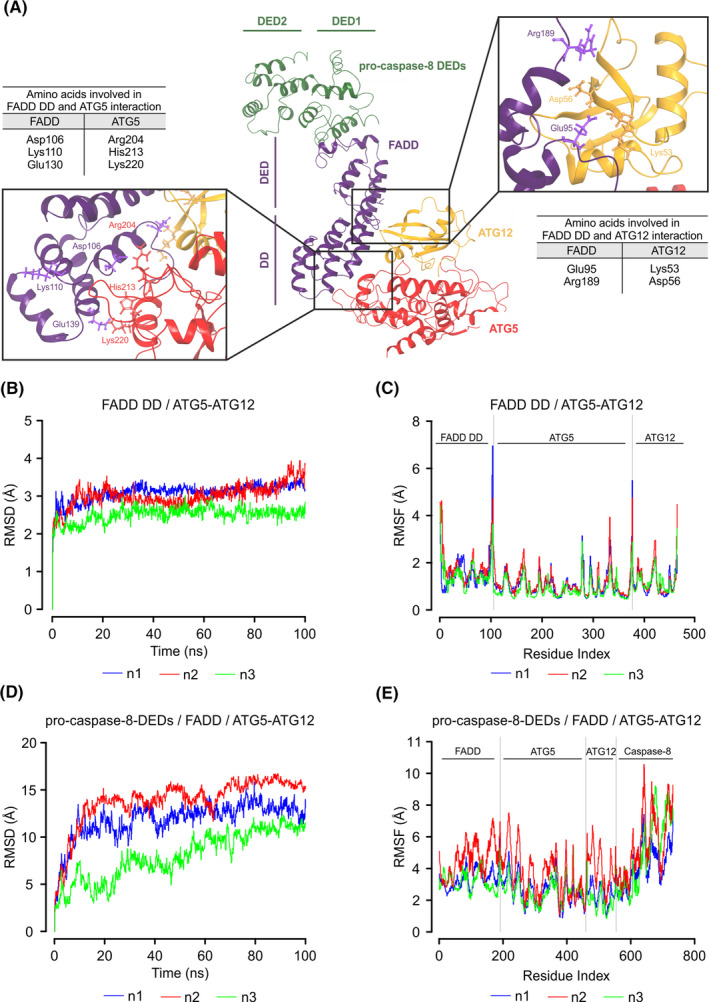
FIGURE 3.

Molecular docking model of the core stressosome components. (A) Ribbon structure representing the complex of pro‐caspase‐8 death effector domains (DEDs) (PDB: 5L08) (green) and full‐length FADD (PDB: 2GF5) (violet) superposed with a complex of ATG5‐ATG12 (PDB: 4GDK) (red‐yellow) and FADD death domain (FADD DD) (PDB: 1E3Y). The key residues involved in the interaction between FADD and ATG5‐ATG12 are indicated (other residues are not labelled for clarity). (B) Root‐mean‐square deviation (RMSD) and (C) root‐mean‐square fluctuation (RMSF) of FADD DD/ATG5‐ATG12 complex. Data show three independent repeats. (D) RMSD and (E) RMSF of pro‐caspase‐8 DEDs/FADD/ATG5‐ATG12 complex. Data show three independent repeats
