
FIGURE 2.
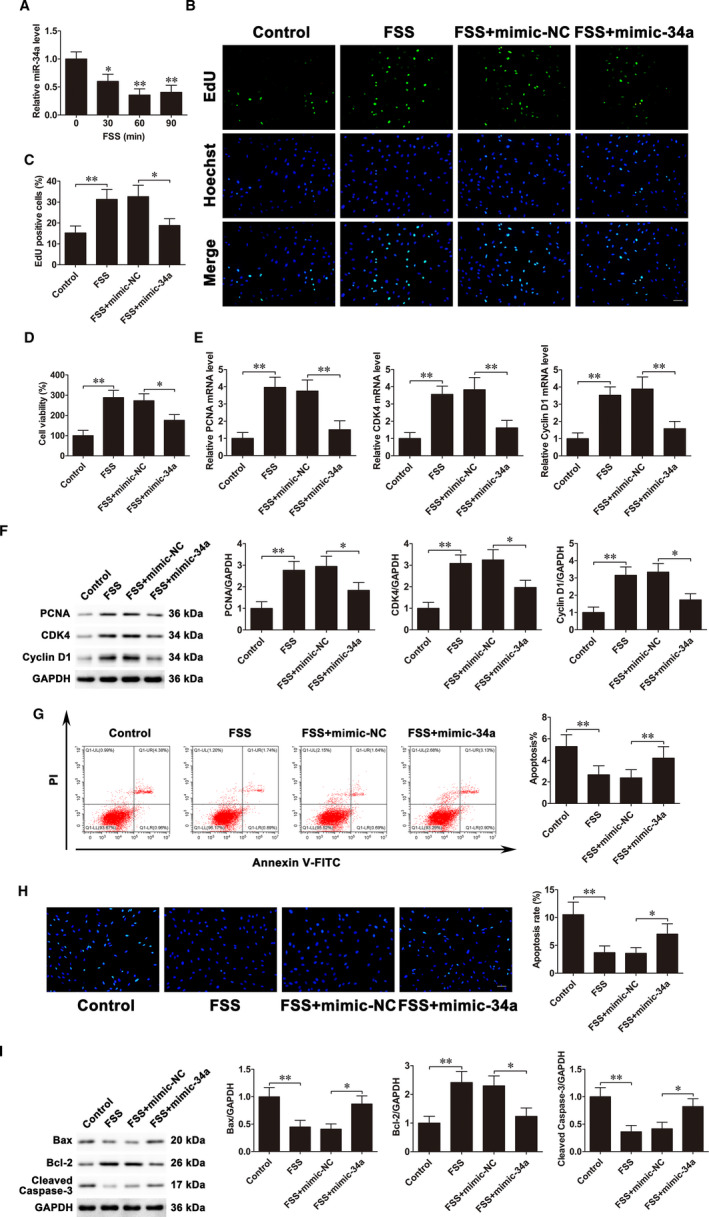
FSS down‐regulates miR‐34a expression levels, and miR‐34a up‐regulation weakens the alterations of osteoblast proliferation and apoptosis under FSS. A, qRT‐PCR analysis of miR‐34a expression levels in MC3T3‐E1 cells treated with FSS for 0 (control), 30, 60 or 90 min. B and C, MC3T3‐E1 cells were transfected with mimic‐34a before exposing to FSS. EdU assays were used to assess cell proliferation. Scale bar=50 μm. D, CCK‐8 assays examined cell proliferation. E, PCNA, CDK4 and Cyclin D1 mRNA expressions. F, PCNA, CDK4 and Cyclin D1 protein expressions. G, Flow cytometry evaluated cell apoptosis. H, Cells were stained with Hoechst. Scale bar=50 μm. I, Bax, Bcl‐2 and cleaved caspase‐3 protein expressions. Data are shown as the mean ±SD. *P < 0.05, **P < 0.01