
FIGURE 6.
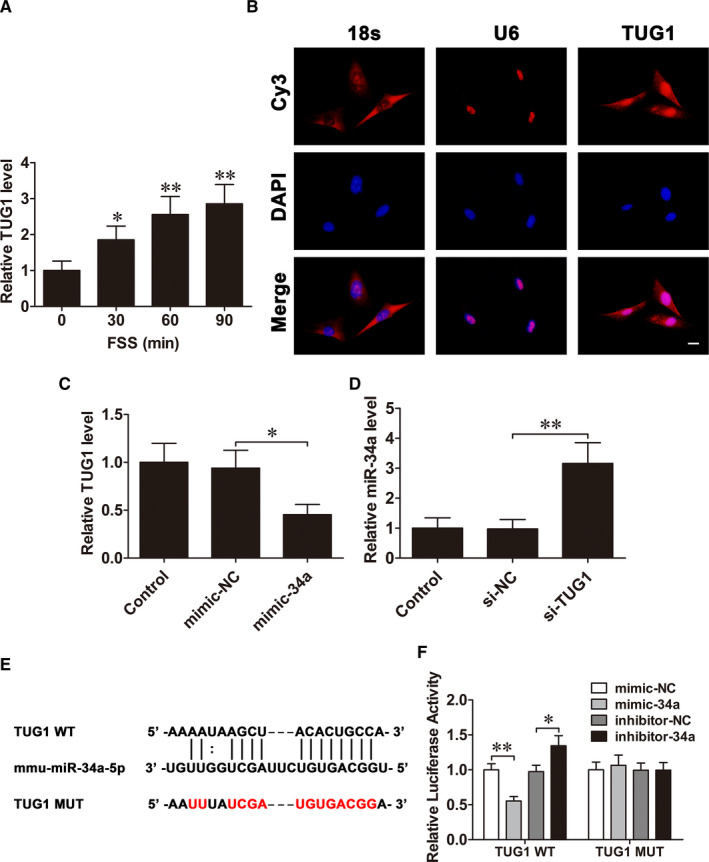
LncRNA TUG1 and miR‐34a interact with and repress each other. A, qRT‐PCR analysis of lncRNA TUG1 expression levels in MC3T3‐E1 cells treated with FSS for 0 (control), 30, 60 or 90 min. B, FISH assay analysed the cellular location of lncRNA TUG1 in osteoblasts. Scale bar=10 µm. C, The lncRNA TUG1 levels in osteoblasts after mimic‐34a transfection. D, The miR‐34a levels in osteoblasts after siRNA‐TUG1 transfection. E, The predicted miR‐34a binding sites in lncRNA TUG1. F, The interaction between lncRNA TUG1 and miR‐34a is identified by luciferase reporter assay. Data are shown as the mean ±SD. *P < 0.05, **P < 0.01