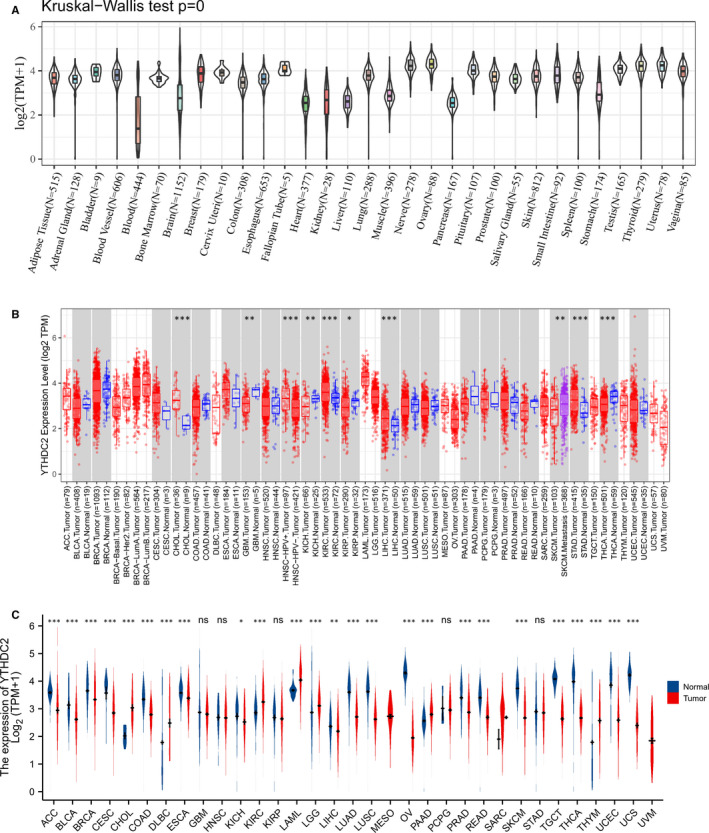
FIGURE 1.

Expression level of YTHDC2 gene in tumours and normal tissues. (A) YTHDC2 expression in normal tissues. (B) YTHDC2 expression in TCGA tumours and adjacent normal tissues. (C) YTHDC2 expression in TCGA tumours and normal tissues with the data of the GTEX database as controls. *p < 0.05, **p < 0.01, ***p < 0.001, the asterisk represents the degree of importance (*p). The significance of the two groups of samples passed the Wilcox test
