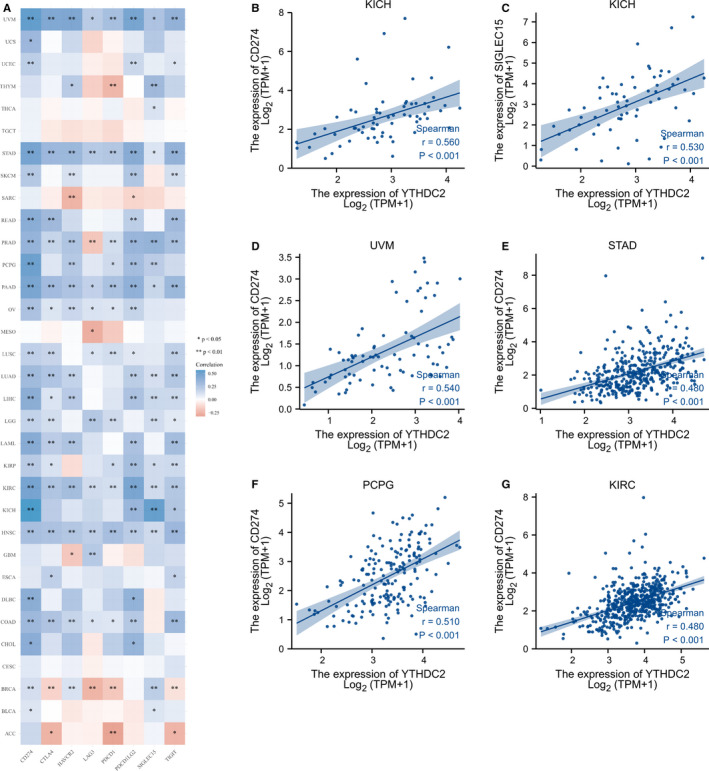
FIGURE 5.

Correlations between YTHDC2 expression and immune checkpoint‐related genes. (A) The expression heat map of immune checkpoint‐related genes in different tumour tissues and the correlations with YTHDC2. (B) Correlation between YTHDC2 and CD274 in KICH. (C) Correlation between YTHDC2 and SIGLECT15 in KICH. (D) Correlation between YTHDC2 and CD274 in UVM. (E) Correlation between YTHDC2 and CD274 in STAD. (F) Correlation between YTHDC2 and CD274 in PCPG. (G) Correlation between YTHDC2 and CD274 in KIRC
