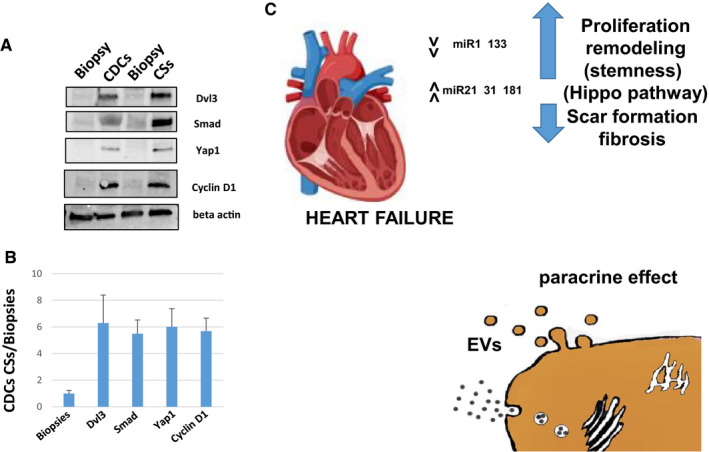
FIGURE 8.

Western blot analysis on Hippo pathway proteins. (A) Cell extracts from Biopsies, CDCs and CSs were used to evaluate Dvl3, SMAD 1/2/3, Yap1 and cyclin D1, the beta‐actin as control. All proteins appear clearly overexpressed in CDCs/CSs and not in the corresponding biopsies (two out of four sample patients have been shown). (B) Intensity ratio of the indicated proteins: CDCs and CSs vs Biopsies (the analysis has been carried on four different samples in triplicate p value ≤0.05) (C) Schematic representation of miRNA’s mechanism of action as illustrated in the Discussion
